
Access to hospital procedures
First Nations people are more likely to be hospitalised than non-Indigenous Australians but are less likely to receive a medical or surgical procedure while in hospital.
Over the period July 2019 to June 2021, there were 444,091 First Nations hospitalisations (excluding dialysis) where a medical or surgical procedure was recorded in both private and public hospitals, accounting for two-thirds (66%) of all First Nations hospitalisations. After adjusting for differences in the age structure between the two populations, the proportion of hospitalisations that included a procedure for First Nations people was 0.8 times the rate of non-Indigenous Australians.
For First Nations people, the proportion of hospitalisations where a procedure was recorded decreased as remoteness of usual residence increased, declining from 70% in Major cities to 56% in Very remote areas (Figure 6.9).
Between 2011–12 and 2020–21, the age-standardised proportion of hospitalisations where a procedure was recorded increased by 19% for First Nations people, with a smaller increase for non-Indigenous Australians (2.3%) (Figure 6.9).
As a result, the absolute gap (rate difference) between First Nations people and non-Indigenous Australians in the proportion of hospitalisations where a procedure was recorded narrowed (from 20 to 12 percentage points). The relative gap (rate ratio) changed from 0.7 in 2011–12 to 0.8 in 2013–14 and then remained at 0.8 in subsequent years.
Figure 6.9: Proportion of hospitalisations that included a procedure, for First Nations people by remoteness (crude proportion, July 2019 to June 2021), and by Indigenous status (age-standardised, 2011–12 to 2020–21)
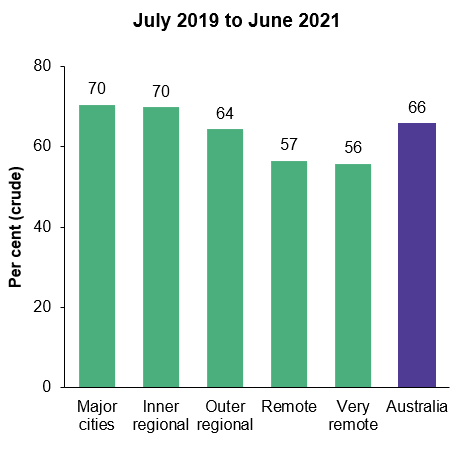
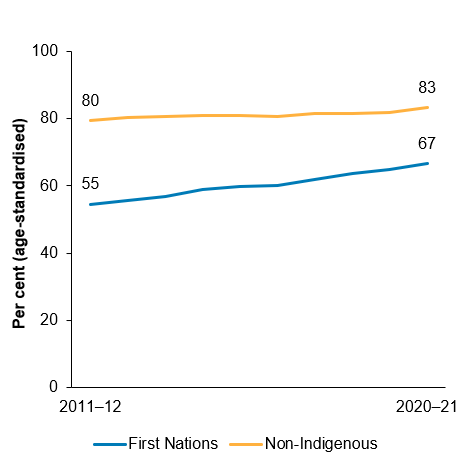
Source: Measure 3.06, Table D3.06.1 and Table D3.06.11 – AIHW analysis of National Hospital Morbidity Database.
Over the period from July 2019 to June 2021, First Nations people were most likely to have a procedure recorded where the principal diagnosis was cancer and other neoplasms (93.5% of all hospitalisations for such a diagnosis) and diseases of the eye and adnexa (93.2%). Respiratory diseases and infectious and parasitic disorders were the least likely to include a procedure (51.7% and 44.3%, respectively).
For further information, see: