
Potentially preventable hospitalisations
Potentially preventable hospitalisations is a key measure of the performance of the health system and serves as a proxy measure of access to timely, effective and appropriate primary and community-based health care. From July 2019 to June 2021, 91,703 hospitalisations of First Nations people were considered potentially preventable. This equates to a rate of 53 potentially preventable hospitalisations (PPH) per 1,000 First Nations people.
For First Nations males, the rate of PPH was lowest for those aged 15–24 (17 per 1,000) and for females the rate was lowest for those aged 5–14 (23 per 1,000). Among First Nations males and females the rate of PPH increased with age from those aged 25–34 (28 and 48 per 1,000, respectively) to those aged 65 and over (155 and 163, per 1,000) with the rate being higher for First Nations females in all these age groups. Among people of all ages, the age-standardised rate of PPH was 3.0 times as high for First Nations people as the rate for non-Indigenous Australians.
The age-standardised rate of PPH for First Nations people increased between 2013–14 and 2018–19 (from 63 to 75 PPH per 1,000 population), with a larger increase for First Nations females (from 65 to 82 PPH per 1,000) than males (from 62 to 68 PPH per 1,000) (Figure 6.5). However, the PPH rate decreased between 2018–19 and 2020–21, from 75 PPH per 1,000 to 68 PPH per 1,000 population (from 82 to 73 for females, and from 68 to 63 for males). This was mainly due to a decrease in vaccine-preventable hospitalisations (Figure 6.5). The decrease coincides with the COVID-19 pandemic, and the public health measures put in place to control the pandemic (such as physical distancing, mask-wearing and handwashing) would have also affected the spread of other infectious diseases.
Figure 6.5: Potentially preventable hospitalisation rates (age-standardised), by Indigenous status and sex, 2013–14 to 2020–21
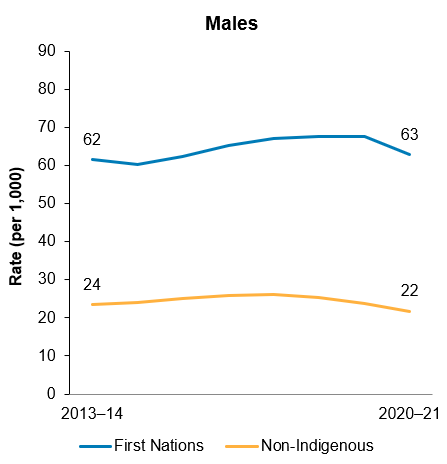
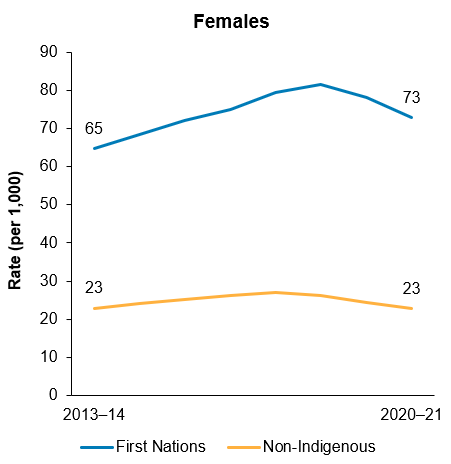
Note: Comparable data prior to 2013–14 is not available.
Source: Measure 3.07, Table D3.07.11 – AIHW analysis of National Hospital Morbidity Database.
Among First Nations people in 2019–21, the rate of PPH was highest for those living in Remote areas (97 hospitalisations per 1,000 population), followed by those in Very remote areas (91 per 1,000). The rate was lowest for those in Major cities and Inner regional areas (both around 40 per 1,000) (Figure 6.6).
Figure 6.6: Potentially preventable hospitalisations for First Nations people, by remoteness, July 2019 to June 2021
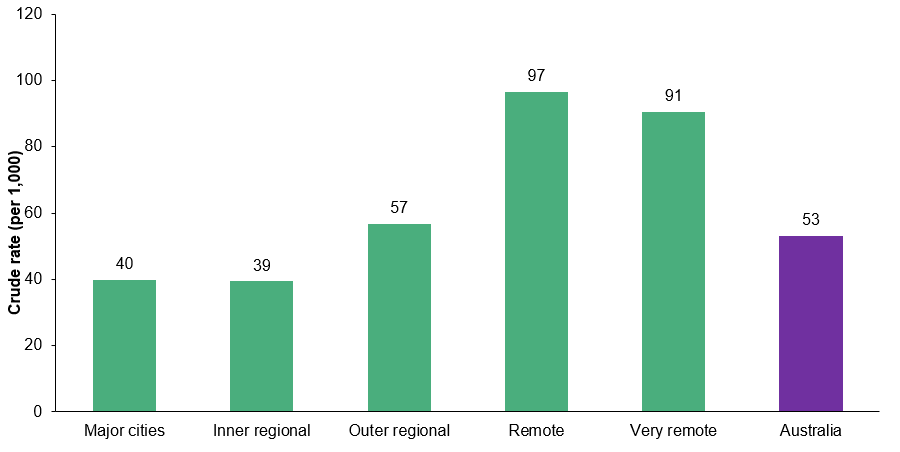
Note: ‘Remote’ excludes remote Victoria.
Source: Measure 3.07, Table D3.07.3 – AIHW analysis of National Hospital Morbidity Database.
From July 2019 to June 2021, the top 5 causes of PPH were:
- cellulitis (a bacterial skin conditions) – 10,324 hospitalisations (11.3% of PPH), at a rate of 6.0 per 1,000 population
- chronic obstructive pulmonary disease – 10,276 hospitalisations (11.2% of PPH), at a rate of 6.0 per 1,000
- diabetes complications – 8,829 hospitalisations (9.6% of PPH), at a rate of 5.1 per 1,000
- dental complications – 8,345 hospitalisations (9.1% of PPH), at a rate of 4.8 per 1,000
- urinary tract infections (including pyelonephritis) – 8,272 hospitalisations (9.0% of PPH), at a rate of 4.8 per 1,000 population (Figure 6.7).
Figure 6.7: Top 5 causes of potentially preventable hospitalisations among First Nations people, July 2019 to June 2021
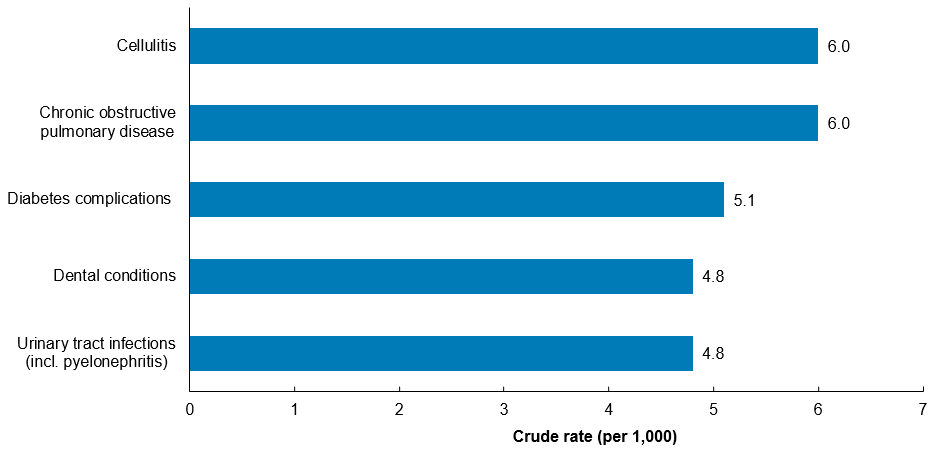
Source: Measure 3.07, Table D3.07.5 – AIHW analysis of National Hospital Morbidity Database.
The age-standardised rate of hospitalisations for the top 5 potentially preventable conditions was higher for First Nations people than non-Indigenous Australians (ranging between 1.5 and 6 times as high).
For further information, see: