
Key messages
-
Life expectancy measures how long, on average, a group of people might expect to live. It is a useful summary measure of population health that reflects the combined effects of socioeconomic factors, health risk behaviours and access to high-quality health care services. Variations in life expectancy not only express the expected differences in population longevity but also are indicators of socioeconomic equity and justice.
-
Life expectancy estimates for Aboriginal and Torres Strait Islander (First Nations) people cannot be compared over time using current methods of deriving life expectancy, as the way people identify or are identified in the source data (deaths and population data) changes in each Census. Changes in coverage and responses complicates the estimation of genuine health improvements between successive Censuses.
-
While a useful indicator, life expectancy is not an exact measure of how long individuals will live or how healthy and happy they will be throughout their life. Cultural wellbeing, for example, is central to the health of First Nations people but is not a component of life expectancy measurement.
-
The life expectancy for First Nations males born in 2020–2022 was around 8.8 years lower than that of non-Indigenous males (71.9 years compared with 80.6 years). For First Nations females, life expectancy at birth was around 8.1 years lower than for non-Indigenous females (75.6 years compared with 83.8 years).
-
First Nations males living in the least disadvantaged areas could expect to live to 74.6 years– about 5 years longer than those living in the most disadvantaged areas (69.5 years). The life expectancy disparity between the least and most disadvantaged socioeconomic areas was larger for First Nations males than First Nations females, with a difference of 5.1 years and 3.0 years, respectively.
-
Life expectancy was lower for First Nations people living in remote than non-remote areas, while it was similar across remoteness areas for non-Indigenous Australians. This resulted in a larger gap between First Nations people and non-Indigenous Australians in Remote and very remote areas (12.4 years for both males and females), than in Major cities or Inner and outer regional areas (between 6.5 and 8.5 years).
-
Multiple studies have found that targeted health care has significantly contributed to increased life expectancy for First Nations people, however these measures alone are insufficient to fully close the gap. The persistence of a substantial life expectancy gap underscores the impact of socioeconomic disadvantage that needs to be addressed to further life expectancy gains.
Why is it important?
Life expectancy is a useful integrated summary measure of population health (Barnes et al. 2008) and reflects performance against every measure in the Aboriginal and Torres Strait Islander Health Performance Framework. It is one of the most frequently used indicators to assess mortality risks and average longevity for a population group. Life expectancy is a synthetic measure of mortality that has the advantage of allowing for comparisons between different groups (Alameda County Public Health Department 2017; Egidi & Spizzichino 2008). While life expectancy at birth measures how long, on average, a group of people might expect to live if they experienced the age and sex specific death rates that were current at the time of their birth, it is not an exact measure of how long individuals will live or how healthy and happy they will be throughout their life (ABS 2018). Cultural wellbeing, for example, is central to the health of Aboriginal and Torres Strait Islander (First Nations) people (Australian Human Rights Commission 2015) but is not a component of life expectancy measurement.
The World Health Organisation (WHO) defines health as not merely the absence of infirmity and disease but a state of physical, mental and social wellbeing, a definition that First Nations people extend to include social, emotional, spiritual, and cultural wellbeing of the whole community. The health of First Nations people is intricately linked to their socioeconomic status, with lower education levels, higher unemployment rates and greater financial stress contributing to poorer health outcomes. Historical factors such as dispossession of land, exclusion from citizenship rights and the legacy of the stolen generations have enduring negative effects on health. Conversely, participation in cultural events and a strong sense of community offer protective health benefits. Living in remote areas is associated with better self-assessed health, potentially due to stronger cultural ties and fewer urban stressors. However, the complex interplay of these determinants poses challenges in isolating their specific effects on life expectancy. The reliance on subjective self-reported health measures, the impact of ongoing discrimination, and the lack of longitudinal data specifically designed for First Nations populations further complicate accurate measurement. Mainstream health determinants and measures typically have not captured culturally specific factors critical to First Nations health, necessitating a multifaceted approach to health improvement (Biddle 2012).
Life expectancy reflects the combined effects of socioeconomic factors, health risk behaviours and access to high-quality health care services. Variations in life expectancy not only express the expected differences in population longevity but also are indicators of socioeconomic equity and justice.
Life expectancy for the Australian population has significantly increased since the early 1900s due to improvements in water supply, sewerage systems, food quality and health education, which have reduced exposure to infectious diseases. Medical advancements, such as mass immunisation, antibiotics, public health strategies and improvements in treatment, have also played a crucial role. In the 21st century, gains have continued due to lower infant and child death rates, fewer deaths from motor vehicle accidents and heart disease, healthier diets, reduced smoking, better healthcare access and increased wealth (AIHW 2023). These improvements have not been equally experienced among Australia’s First Nations population.
In Australia, the life expectancy gap between First Nations people and non-Indigenous Australians represents 'arguably the most important, and certainly most symbolic, indicator of Indigenous disadvantage' (Banks 2009).
In 2008, the Council of Australian Governments committed to closing the gap in life expectancy between First Nations people and non-Indigenous Australians within a generation (by 2031) (COAG 2008). The health disparities between First Nations people and non-Indigenous Australians are influenced by cultural and social determinants of health, differences in health risk factors, and equitable access to appropriate health services. It is well documented and acknowledged that First Nations people are subjected to socioeconomic disadvantage and health inequality, with colonisation playing a critical role through economic and social systems that perpetuate disparities. Colonisation and subsequent discriminatory government policies, the ongoing effects of entrenched disadvantage, political exclusion, intergenerational trauma, and institutional racism have fundamentally affected the health risk factors, social determinants of health, and has ultimately led to poorer outcomes for First Nations people (AIHW 2022b; Productivity Commission 2023).
The National Agreement on Closing the Gap (the National Agreement) was developed in partnership between Australian governments and the Coalition of Aboriginal and Torres Strait Islander Peak Organisations. The National Agreement has been built around four Priority Reforms that have been directly informed by First Nations people. These reforms are central to the National Agreement and will change the way governments work with First Nations people, including through working in partnership and sharing decision making, building the Aboriginal community-controlled sector, transforming government organisations, and improving and sharing access to data and information to enable informed decision making by First Nations communities.
The National Agreement has identified the importance of making sure First Nations people enjoy long and healthy lives. To support this outcome the National Agreement specifically outlines the following target to direct policy attention and monitor progress:
- Target 1—Close the Gap in life expectancy within a generation, by 2031.
A range of indicators are used to support this target including all-cause mortality; leading causes of death; and potentially avoidable mortality among others. For the latest data on the Closing the Gap targets, see the Closing the Gap Information Repository.
Note that the accuracy of life expectancy estimates for First Nations people is affected by the quality of both the underlying deaths and population data. The quality of Indigenous identification in deaths data varies by state and territory, although there have been improvements over time. Additionally, there have been large non-demographic increases in the First Nations population between Censuses, due to factors such as changes in Indigenous identification and changes in Census coverage. Using current methods, changes over time in the way people are identified in deaths and population data complicates the assessment of genuine health improvements between successive Censuses. Notwithstanding this, successive reports on the target to close the gap in life expectancy by 2031 have shown the target is not on track. Closing the gap in life expectancy requires both identifying the mortality patterns that underpin the differences and understanding the broader determinants of those patterns (such as individual, community, structural, cultural, historical and political factors) which can be used to guide policies to improve health outcomes and decrease death rates (Ring & Griffiths 2022; State of Queensland (Queensland Health) 2019).
The National Aboriginal and Torres Strait Islander Health Plan 2021-2031 (the Health Plan) continues to guide actions to ensure First Nations peoples can live long and healthy lives. The Health Plan was co-designed in genuine partnership and outlines priority areas identified by First Nations health leaders to drive action and reform.
The National Agreement and the Health Plan are discussed further in the Implications section of this measure.
Data findings
Life expectancy refers to the average number of additional years a person of a given age and sex could be expected to live, assuming current age-sex specific death rates are experienced throughout their lifetime (see also Box 1.19.1).
A First Nations baby girl born in 2020–2022 can expect to live to 75.6 years, and a First Nations baby boy to 71.9 years (Table D1.19.1, Figure 1.19.1).
Life expectancy changes over the course of a person’s life. As they survive the periods of birth, childhood and adolescence, their chance of reaching older age increases. The life expectancy at different ages can be presented as the number of additional years a person can expect to live.
Life expectancy is higher for First Nations females than males across the life course, however the difference decreases progressively with age. At birth, the life expectancy difference between First Nations males and females was around 3.8 years in the period 2020–2022. First Nations females aged 65–69 could expect to live another 16.7 years, which was 1.2 years longer than life expectancy for First Nations males in the same age group (15.5 years). By age 85, the difference reduced to 0.1 years, with life expectancies for First Nations males and females of a further 4.4 and 4.5 years respectively (Table D1.19.2, Figure 1.19.1).
Figure 1.19.1: Remaining life expectancy for First Nations people at selected ages, by sex, 2020–2022
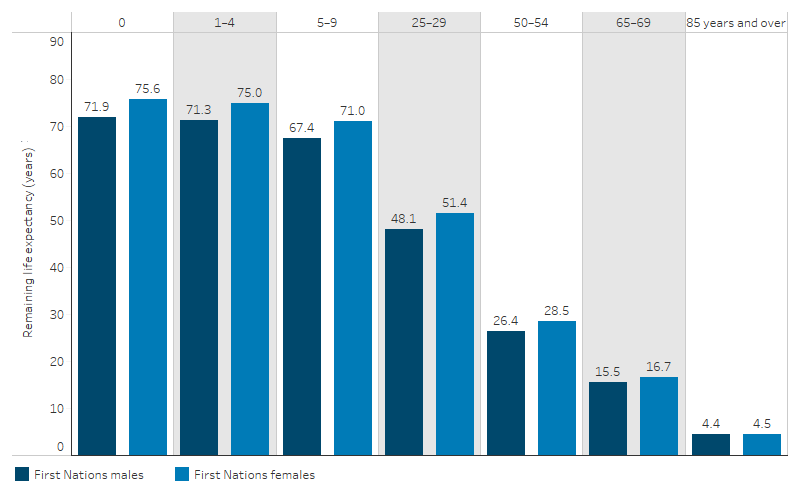
Source: Table D1.19.2. ABS Aboriginal and Torres Strait Islander life expectancy estimates.
Life expectancy by states and territories
Life expectancy for First Nations people varied according to where they were living. Data are available for four jurisdictions that have populations of sufficient size to calculate life expectancy estimates for First Nations people (New South Wales, Queensland, Western Australia and the Northern Territory).
In 2020–2022, life expectancy of First Nations people in these 4 jurisdictions was estimated to be highest in New South Wales and lowest in the Northern Territory.
Life expectancy at birth was 73.8 years for First Nations males in New South Wales – 8.2 years higher than for males in the Northern Territory (65.6 years). For First Nations females, life expectancy at birth was 77.9 years in New South Wales – 8.5 years higher than in the Northern Territory (69.4 years) (Table D1.19.1, Figure 1.19.2).
Across all four jurisdictions, life expectancy at birth was higher for females than males, with the difference ranging between 3.7 and 4.1 years (Table D1.19.1, Figure 1.19.2).
Figure 1.19.2: Life expectancy at at birth (with 95% confidence intervals) for First Nations people, by sex and jurisdiction, 2020–2022
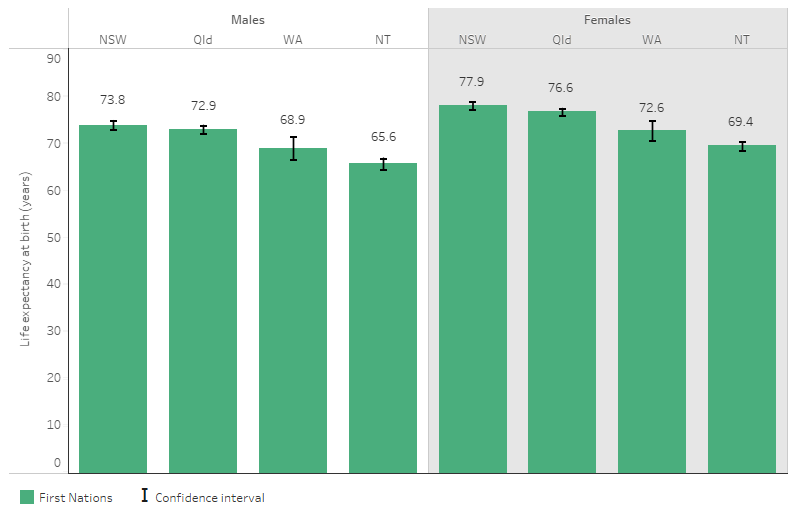
Note: 95% confidence interval (CI) for the estimate indicates that 95% of the time the true value of the estimate is expected to fall in between the lower and upper limits. A narrow CI indicates good precision (or little random error) and, conversely, a wider CI indicates poorer precision. Estimates of any two groups are statistically different if their 95% CIs do not overlap. See Statistical terms and methods for more information.
Source: Table D1.19.1 & ABS Aboriginal and Torres Strait Islander life expectancy estimates (ABS 2023a).
Life expectancy by remoteness areas
For First Nations people, life expectancy was lower in remote than non-remote areas. Life expectancy at birth for First Nations males living in Remote and very remote areas was estimated to be 5.3 years lower than that of First Nations males living in Major cities (67.3 years compared with 72.5 years). For First Nations females, life expectancy at birth was 5.2 years lower for those living in Remote and very remote areas compared with those in Major cities (71.3 compared with 76.5 years) (Table D1.19.3, Figure 1.19.3).
Figure 1.19.3: Life expectancy at birth (with 95% confidence intervals) for First Nations people, by sex and remoteness, 2020–2022
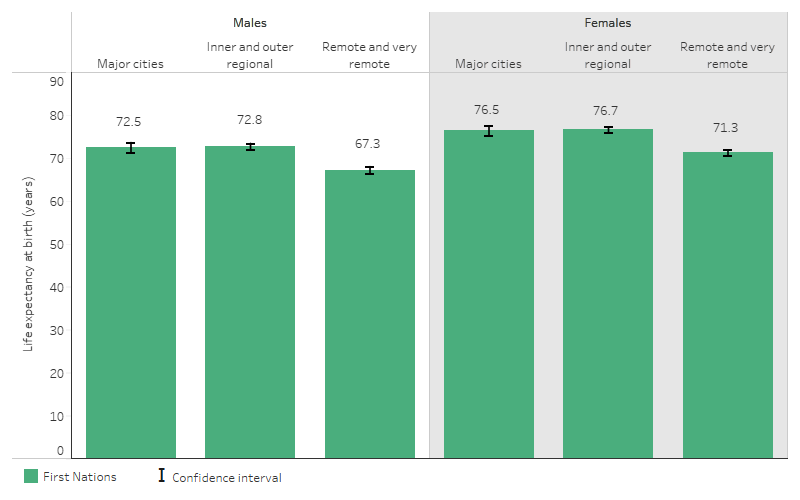
Note: 95% confidence interval (CI) for the estimate indicates that 95 % of the time the true value of the estimate is expected to fall in between the lower and upper limits. A narrow CI indicates good precision (or little random error) and, conversely, a wider CI indicates poorer precision. Estimates of any two groups are statistically different if their 95% CIs do not overlap. See Statistical terms and methods for more information.
Source: Table D1.19.3 & ABS Aboriginal and Torres Strait Islander life expectancy estimates (ABS 2023a).
Life expectancy by socioeconomic areas
The socioeconomic position of an individual influences their access to vital resources for maintaining good health. Generally, those in higher socioeconomic positions tend to have a better quality of life and health outcomes compared with those in lower positions. This is known as the 'social gradient of health' (WHO 2022).
The Socio-Economic Indexes for Areas (SEIFA) Index of Relative Socio-economic Disadvantage (IRSD) ranks areas based on level of disadvantage (ABS 2023c) (see measure 2.09 Socioeconomic indexes). The lowest scoring group (20% of areas) are referred to in this measure as the 'most disadvantaged' areas, and the second lowest scoring group (second 20% of areas) are referred to as 'second most disadvantaged' areas. The third (middle) group is referred to as the 'middle 20%'. The highest and second highest scoring IRSD groups were combined (40% of areas) to improve reliability of the life expectancy estimates and are collectively referred to as the 'least disadvantaged areas'. Note that the data relate to socioeconomic characteristics of the areas as a whole, including the non-Indigenous population, and do not reflect the socioeconomic characteristics of all individuals living in those areas.
In 2020–2022, life expectancy at birth for First Nations people was:
- 74.6 for males living in the least socioeconomically disadvantaged areas compared with 69.5 for males living in the most disadvantaged areas and 71.7 in the second most disadvantaged areas
-
77.0 years for females living in the least socioeconomically disadvantaged areas, compared with 74.0 for females living in the most disadvantaged socioeconomic areas, and 75.7 in the second most disadvantaged areas (Table D1.19.4, Figure 1.19.4).
The disparity in life expectancy between the least and most disadvantaged socioeconomic areas was larger for First Nations males than First Nations females, with a difference of 5.1 years and 3.0 years, respectively.
Figure 1.19.4: Life expectancy at birth (with 95% confidence intervals) for First Nations people, by sex and level of socioeconomic disadvantage of the area, 2020–2022
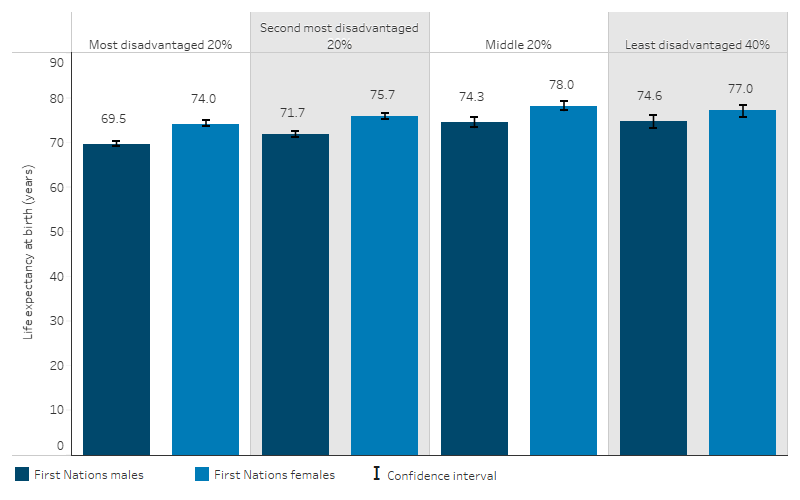
Note: 95% confidence interval (CI) for the estimate indicates that 95 % of the time the true value of the estimate is expected to fall in between the lower and upper limits. A narrow CI indicates good precision (or little random error) and, conversely, a wider CI indicates poorer precision. Estimates of any two groups are statistically different if their 95% CIs do not overlap. See Statistical terms and methods for more information.
Source: Table D1.19.4 & ABS Aboriginal and Torres Strait Islander life expectancy estimates (ABS 2023a).
Comparisons with non-Indigenous Australians
Life expectancy for First Nations males born in 2020–2022 was around 8.8 years lower than for non-Indigenous males – 71.9 years compared with 80.6 years. For First Nations females, life expectancy at birth was around 8.1 years lower than that for non-Indigenous females – 75.6 years compared with 83.8 years.
Across all age groups, life expectancy for First Nations males and females in 2020–2022 was consistently lower than that of non-Indigenous males and females (Table D1.19.2, Figure 1.19.5). However, as people age, the size of the life expectancy gap in years generally decreases.
Figure 1.19.5: Remaining life expectancy by selected age cohorts, by Indigenous status and sex, 2020–2022
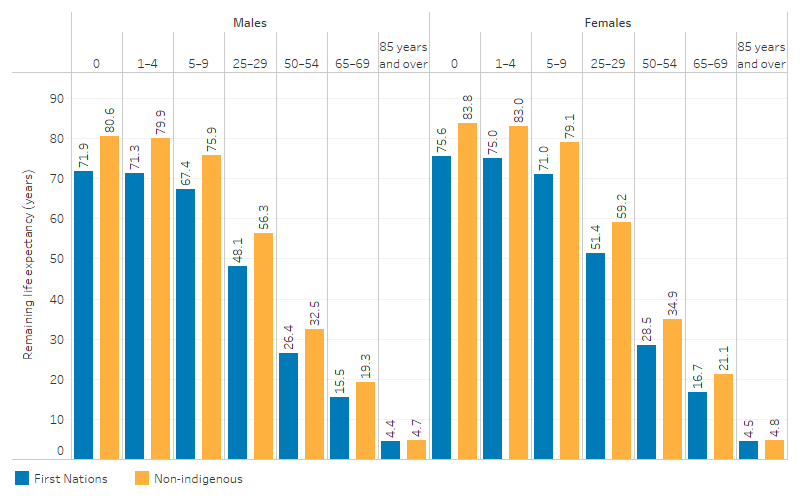
Source: Table D1.19.2. ABS Aboriginal and Torres Strait Islander life expectancy estimates (ABS 2023a).
The disparity in life expectancy between First Nations people and non-Indigenous Australians varied across states and territories. The difference in life expectancy at birth in 2020–2022 was lowest in New South Wales, with a gap of 6.8 years for males and 5.9 years for females. The Northern Territory had the highest disparity, with a gap of 13.5 years for males and 13.8 years for females (Table D1.19.1).
A higher proportion of First Nations people live in Remote and very remote areas than non-Indigenous Australians (15% compared with 1%) (ABS 2023a). While life expectancy for First Nations people living in Major cities and Inner and outer regional areas was higher compared with those living in Remote and very remote areas, life expectancy for non-Indigenous Australians was similar across all remoteness categories. This resulted in a higher increased life expectancy gap between First Nations people and non-Indigenous Australians in Remote and very remote areas, with both males and females experiencing a gap of 12.4 years, compared with a gap of 8.5 and 7.5 years for males and females respectively in Major cities, and a gap of 6.8 and 6.5 years in Inner and outer regional areas (Table D1.19.3).
Life expectancy for First Nations people was lower than that of non-Indigenous Australians across all socioeconomic areas. Even for First Nations people in the least disadvantaged areas, life expectancy was lower (74.6 years for males and 77.0 years for females) than the life expectancy for non-Indigenous Australians in the most disadvantaged areas (78.4 years for males and 82.3 years for females) (Table D1.19.4). It is also important to note that a higher proportion of First Nations people live in the most disadvantaged areas than the non-Indigenous populations (39% compared with 18% based on the SEIFA quintile) (ABS 2023a).
International comparisons of life expectancy
Caution is needed in making international comparisons of life expectancy, as the quality of deaths data and methods of producing the life expectancy estimates vary. Higher income per capita is generally associated with higher life expectancy, although there are some variations across countries, for example, the United States had lower life expectancy than other countries with similar incomes.
In 2021, the average life expectancy for 38 Organisation for Economic Co-operation and Development (OECD) member countries was 80.3 years, ranging from 73.1 years in Latvia to 84.5 in Japan. Among OECD countries, 27 (71%) had a life expectancy at birth exceeding 80 years, while 4 (11%) had a life expectancy at birth of less than 75 years.
While Australia as a whole had the fourth highest life expectancy of OECD countries, life expectancy for First Nations people in Australia (73.8 years in 2020–2022 on average) was close to that of countries ranked among the bottom two countries– Lithuania (74.2 years in 2021) and Latvia (73.1 years in 2021) (OECD 2023) (Figure 1.19.6).
In New Zealand, life expectancy at birth was 73.4 years for Māori males and 77.1 years for Māori females in 2017–2019. In comparison with non-Māori populations, life expectancy was lower by 7.5 years for Māori males and 7.3 years for Māori females (Statistics New Zealand 2021).
Figure 1.19.6: Life expectancy at birth, OECD countries, 2021 (or as indicated(a))
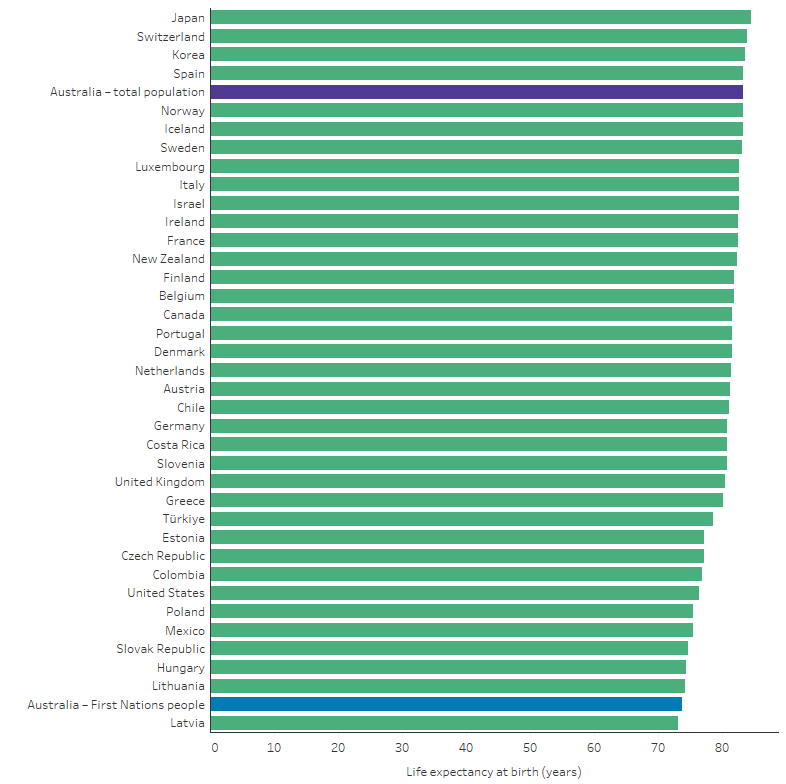
(a) The life expectancy value for the United Kingdom is for 2020, and the life expectancy value for Türkiye is for 2019. Data for First Nations people are for 2020–2022, with the values for males and females averaged to derive estimate for total population. All other data are for 2021.
Sources:
1. First Nations people data: Table D1.19.1. ABS Aboriginal and Torres Strait Islander life expectancy estimates.
2. OECD Health at a Glance 2023 (from: OECD 2023).
Research and evaluation findings
Cultural determinants are anchored in Aboriginal and Torres Strait Islanders ways of knowing, being and doing that encompass a holistic understanding of health and wellbeing. Culture is central to this understanding and shapes the relationship between self to Country, kin, community and spirituality— all of which are key factors of health and wellbeing. This notion extends to a First Nations focus on life-giving values from which individuals, families and communities can draw strength, resilience and empowerment (Verbunt et al. 2021; Williamson et al. 2020). The cultural determinants approach has demonstrated significant health gains in indigenous populations internationally, such as the 'Māori renaissance' in Aotearoa, New Zealand. In Canada, indigenous communities with strong cultural continuity had distinctly lower suicide rates compared to those with dislocated cultural practices. A meta-synthesis of qualitative research in Canada and the United States further outlined the importance of cultural continuity for indigenous health and wellbeing outcomes. A review of international evidence supported positive associations between wellbeing and indigenous cultures but noted the need for further research to better understand the complex causal pathways through which cultural determinants influence health outcomes (Verbunt et al. 2021).
Research has found that life expectancy is affected by several factors, including health risk behaviours, socioeconomic factors and environmental factors (such as overcrowded housing and sanitation) (AIHW 2018; SCRGSP 2016; Zhao et al. 2013). It has been found that:
- A broad range of health risk factors accounted for around two-thirds (66%) of the gap in disease burden between First Nations and non-Indigenous Australians, according to the 2018 Australian Burden of Disease study.
-
Tobacco use was the leading risk factor, accounting for 20% of the gap in disease burden between First Nations and non-Indigenous Australians (AIHW 2022a).
-
- There is significant overlap between social determinants and health risk factors. For example, in 2018–19, among First Nations adults, the proportion who did not smoke was higher among those who:
-
were employed, compared with those not employed (including those not in the labour force) (66% compared with 48%, respectively)
-
had completed Year 12 or equivalent, compared with those with a Year 10 or lower level of school qualification (71% compared with 49%, respectively) (ABS 2019).
-
Studies have noted the link between improvements in health services access and chronic disease management and gains in life expectancy among First Nations people:
-
Recent life expectancy increases among First Nations people in the Northern Territory, across all adult age groups, were consistent with improved health service access and chronic disease management (Georges et al. 2017).
-
In Queensland, 36% of the First Nations male life expectancy increase and 48% of the First Nations female life expectancy increase, between 2010–12 and 2015–17, can be attributed to the reduced mortality rate from cardiovascular disease (primarily coronary heart disease and stroke) (Queensland Health 2019).
-
In Queensland, reduction in diabetes mortality contributed 0.5 and 0.3 years to the increased life expectancy of First Nations males and First Nations females, respectively (Queensland Health 2019).
Over time, life expectancy improvements for First Nations people living in the Northern Territory have shifted from younger to older age groups. Between 1967–1971 and 1980–1984, there were rapid rises in life expectancy through reduced infant mortality. More recently, from 1994–1998 to 2008–2012, there were modest gains in older age groups. The higher mortality of First Nations people living in the Northern Territory aged 35–74 accounted for 73% of the gap in life expectancy between them and all Australians (Georges et al. 2017).
A Northern Territory study found that over the period 1999 to 2018, life expectancy improvements for First Nations people were driven by fewer years of life lost due to cancer, injuries, and chronic disease. Non-Indigenous people saw smaller gains in life expectancy over the same period, which were driven by improved survival for those with cancer and neurological conditions (Canuto et al. 2022; Zhao et al. 2022).
Over the last several decades, the predominant causes of death of First Nations people shifted from maternal, perinatal and infectious diseases to chronic diseases (Condon et al. 2004; Zhang & Dempsey 2006). A transition in nutrition from childhood malnourishment and stunting to overeating—often of food high in calories but of poor nutritional quality—is likely to have contributed to the increased prevalence of chronic diseases (Gracey & King 2009). Concurrently, socioeconomic disadvantage, is contributing as much as half of the gap in life expectancy between First Nations and non-Indigenous populations in the Northern Territory (Georges et al. 2017).
This suggests that targeted health care can improve life expectancy, but it will have a limited effect on the life expectancy gap unless socioeconomic disadvantage and its associated risks are also reduced (Georges et al. 2017; Ring & Griffiths 2022). A review found that First Nations clients highly valued Aboriginal Community Controlled Health Organisations (ACCHOs) for their accessibility, culturally safe care, and holistic approach. First Nations clients particularly appreciated the welcoming environments, personal and respectful care from First Nations staff, and the inclusion of non-clinical services, which contribute to addressing socioeconomic determinants of health more effectively than mainstream services. The authors emphasise the need for greater support from the broader health care system to ensure ACCHOs can remain responsive and sustainable. Additionally, there is a role for mainstream practitioners to improve care for First Nations people by investing in understanding First Nations clients' needs and culture, adopting flexible and proactive care approaches, and making clinics more welcoming by incorporating First Nations cultural elements (Gomersall et al. 2017).
An age-cause decomposition study was conducted using data from 2014 to 2018 to capture disparities in overall life expectancy, healthy life expectancy, and unhealthy life expectancy between First Nations and non-Indigenous populations in the Northern Territory. The study aimed to identify and quantify the causes contributing to these disparities. Results revealed that the gap in healthy life expectancy between First Nations and non-Indigenous males and females was 26.5 and 33.5 years respectively, about double the size of the gap for overall life expectancy. Additionally, the gaps in unhealthy life expectancy for First Nations males and females were found to be 2.2 and 2.6 times longer respectively, that is, First Nations males and females spent more years in poor health. This indicates that First Nations people in the Northern Territory not only have shorter lives but also live more years in poor health. The leading causes contributing to these unhealthy life expectancy disparities included endocrine conditions (for example diabetes), accounting for 23-26% of the gap, followed by mental health conditions and substance use accounting for 15% of the gap for males and musculoskeletal conditions (for example osteoporosis) accounting for 12% of the gap for females. These differ from those causes typically affecting overall life expectancy, such as cardiovascular diseases, cancers, and unintentional injuries. The findings highlight that the healthy life expectancy for the First Nations population in the Northern Territory is as low as that seen in poor underdeveloped countries. The study also suggests that unhealthy life expectancy is a useful measure of need for health services and support (Zhao et al. 2024).
Implications
Successive reports on the target to close the gap in life expectancy by 2031 have shown the target is not on track. Life expectancy estimates measure how long, on average, people of a particular age and sex are expected to live. It represents a high-level number that highlights where there are gaps between populations or areas but cannot specify why those gaps exist or what can be done to close them. This is due to there being many determinants of health that can influence life expectancy, with each of those determinants working through a set of intervening variables. Challenges in measuring life expectancy also arise due to non-demographic changes in the datasets used, such as shifts in Indigenous status identification and Census coverage. For example, between 2016 and 2021, there was a 25% increase in the number of people identifying as Aboriginal and/or Torres Strait Islander in the Census, with over half of this increase due to non-demographic factors. These changes affect population estimates and, consequently, life expectancy calculations, complicating the interpretation of genuine health improvements (ABS 2023a, 2023d). However, analysis showing the differences in life expectancy within the First Nations population by remoteness and by socioeconomic status is highly useful for identifying sub-populations with the greatest need.
All the measures within the Health Performance Framework in some way relate to life expectancy as a global measure of health. Continued efforts by governments and First Nations people are needed to address health outcomes and improve life expectancy through actions targeting the antecedents of disease, health risk factors, the social and cultural determinants as well as the performance of the health system to meet the needs of First Nations people. The National Agreement seeks to address inequality for First Nations people by enhancing shared decision-making, building the community-controlled sector, improving culturally responsive mainstream institutions, and fostering First Nations-led data initiatives.
The Health Plan, released in December 2021, is the overarching policy framework to drive progress against the Closing the Gap health targets and priority reforms. States, territories and other implementation partners can take flexible approaches to implementing Health Plan priorities. Their approaches will depend on local needs and priorities, led by First Nations people and communities. The Australian Government is working in partnership with First Nations peak and community-controlled organisations to ensure that First Nations people are leading health and wellbeing initiatives. The Department of Health and Aged Care is formally establishing a new First Nations Health Governance Group to embed First Nations leadership in decision-making related to health policies and reforms.
Implementation of the Health Plan aims to drive structural reform towards models of care that are prevention and early intervention focused, with greater integration of care systems and pathways across primary, secondary and tertiary care. It also emphasises the need for mainstream services to address racism and provide culturally safe and responsive care and be accountable to First Nations people and communities. The Australian Government will work with state and territory governments through the National Aboriginal and Torres Strait Islander Health Collaboration to improve cultural safety in health settings for First Nations people. Cultural safety is a focus of the Aboriginal and Torres Strait Islander Collaboration 2023-2034 Work plan, under which states and territories will work to fill existing data gaps by developing measures that report on institutional racism within the health system and measure access by First Nations people to culturally safe health services.
References
- ABS (Australian Bureau of Statistics) 2018. Life Tables for Aboriginal and Torres Strait Islander Australians, 2015-2017. Canberra: Commonwealth of Australia.
- ABS 2019. National Aboriginal and Torres Strait Islander Health Survey, 2018-19. Canberra: ABS.
- ABS 2022. National, state and territory population, Reference Period September 2022. Canberra, Australia: Australian Bureau of Statistics.
- ABS 2023a. Aboriginal and Torres Strait Islander life expectancy. Viewed March 2024,
- ABS 2023b. Estimates of Aboriginal and Torres Strait Islander Australians. ABS Website. Viewed April 2024.
- ABS 2023c. Socio-Economic Indexes for Areas (SEIFA), Australia. ABS Website. Viewed April 2024.
- ABS 2023d. Understanding life expectancy estimates for 2020–2022. Australian Bureau of Statistics.
- AIHW (Australian Institute of Health and Welfare) 2018. Closing the Gap targets: 2017 analysis of progress and key drivers of change. Canberra: AIHW.
- AIHW 2022a. Australian Burden of Disease Study: impact and causes of illness and death in Aboriginal and Torres Strait Islander people 2018. AIHW, Australian Government.
- AIHW 2022b. Determinants of health for Indigenous Australians. AIHW: Australian Government.
- AIHW 2023. How long can Australians live?. AIHW: Australian Government.
- Alameda County Public Health Department 2017. An Introduction to Measures of Mortality: Assessing Overall Health, Cause of Death Rankings, Health-Adjusted Life Expectancy, and Socioeconomic Conditions in Alameda County. Oakland, California.
- Australian Human Rights Commission 2015. Close the Gap–Progress and Priorities Report 2017.
- Banks G 2009. Are we overcoming Indigenous disadvantage. Reconciliation Australia's 'Closing the Gap Conversation'Series, National Library, Canberra 7.
- Barnes T, Smith L, Zhao Y & Guthridge S 2008. A comparative analysis of indirect methodologies for estimating Indigenous life expectancy. Darwin: Charles Darwin University.
- Biddle N 2012. Improving indigenous health: are mainstream determinants sufficient. Survey analysis for indigenous policy in Australia: social science perspectives. Canberra: Australian National University:65-78.
- Canuto K, Canuto KJ, Bonson J & Smith J 2022. Improved life expectancy for Indigenous and non‐Indigenous people in the Northern Territory, 1999–2018: overall and by underlying cause of death. Medical journal of Australia 217:380.
- Counsel of Australian Governments 2008. Council of Australian Governments' Meeting, Communiqué, 2 October 2008. 2 October 2008. Council of Australian Governments Perth.
- Condon J, Barnes T, Cunningham J & Smith L 2004. Demographic characteristics and trends of the Northern Territory Indigenous population, 1966 to 2001. Darwin: Cooperative Research Centre for Aboriginal Health.
- Egidi V & Spizzichino D 2008. Life expectancy: Complex measures of the length and the health related quality of life. Italian Journal of Public Health 5:91-5.
- Georges N, Guthridge SL, Li SQ, Condon JR, Barnes T & Zhao Y 2017. Progress in closing the gap in life expectancy at birth for Aboriginal people in the Northern Territory, 1967–2012. Med J Aust 207:25-30.
- Gomersall JS, Gibson O, Dwyer J, O'Donnell K, Stephenson M, Carter D et al. 2017. What Indigenous Australian clients value about primary health care: a systematic review of qualitative evidence. Australian and New Zealand Journal of Public Health 41:417-23.
- Gracey M & King M 2009. Indigenous health part 1: determinants and disease patterns. Lancet 374:65-75.
- OECD 2023. Health at a Glance 2023: OECD Indicators. OECD Publishing, Paris.
- Productivity Commission 2023. Closing the Gap Annual Data Compilation Report July 2023.
- Queensland Health 2019. Closing the gap performance report 2018. Queensland Government, Queensland State.
- Ring I & Griffiths K 2022. Life expectancy for Indigenous people is improving, but closing the gap remains unacceptably slow. Medical Journal of Australia, 217:26-7.
- Steering Committee for the Review of Government Service Provision 2016. Overcoming Indigenous Disadvantage: Key Indicators 2016. Canberra: Productivity Commission.
- State of Queensland (Queensland Health) 2019. Closing the gap performance report 2018. Brisbane.
- Statistics New Zealand 2021. Growth in life expectancy slows. Viewed April 2024.
- Verbunt E, Luke J, Paradies Y, Bamblett M, Salamone C, Jones A et al. 2021. Cultural determinants of health for Aboriginal and Torres Strait Islander people – a narrative overview of reviews. 20:181.
- World Health Organisation 2022. Social determinants of health. Geneva: WHO. Viewed 22 April 2022.
- Williamson L, Dent P & Bowman N 2020. Culture is Key: towards cultural determinants-driven health policy–final report. Lowitja Institute: Melbourne, Australia.
- Zhang G & Dempsey K 2006. Causes of inequality in life expectancy between Indigenous and non-Indigenous people in the Northern Territory, 1981-2000: a decomposition analysis. Medical Journal of Australia 184:490-4.
- Zhao Y, Li S, Wilson T & Burgess P 2022. Improved life expectancy for Indigenous and non‐Indigenous people in the Northern Territory, 1999–2018: overall and by underlying cause of death. Medical journal of Australia 217:30-5.
- Zhao Y, Unnikrishnan R, Chondur R, Wright J & Green D 2024. Decomposing the gaps in healthy and unhealthy life expectancies between Indigenous and non-Indigenous Australians: a burden of disease and injury study. Population Health Metrics 22:15.
- Zhao Y, Wright J, Begg S & Guthridge S 2013. Decomposing Indigenous life expectancy gap by risk factors: a life table analysis. Population Health Metrics 11:1.