Key messages
- In 2018, 24% of Aboriginal and Torres Strait Islander population had disability (an estimated 139,700 people), based on the Survey of Disability, Ageing and Carers. This includes an estimated 51,100 people with severe or profound disability (8.8% of the Indigenous population). Indigenous Australians were 1.9 times as likely to have disability as non-Indigenous Australians.
- Based on the 2018–19 National Aboriginal and Torres Strait Islander Health Survey (NATSIHS), the four most common self-reported disability types for Indigenous Australians aged 15 and over were physical disabilities (63% of those reporting disability), sight/hearing/speech disabilities (47%), psychological disabilities (23%) and intellectual disabilities (18%).
- The proportion of Indigenous Australians with any type of disability in 2018–19 increased with age, ranging from 33% of those aged 15–24 to 79% of those aged 65 and over (based on the 2018–19 NATSIHS).
- Indigenous Australians aged 15 and over who reported having disability in 2018–19 were less likely than those without disability to be employed (35% compared with 56% respectively), and more likely than those without a disability to be living in households in the lowest income quintile (46% and 33%, respectively), and to have had problems accessing services (53% and 33%, respectively).
- As at 31 December 2022, 42,679 Indigenous Australians were participating in the National Disability Insurance Scheme (NDIS) (7.4% of all participants) – an increase from 36,050 in December 2021. The most common primary disabilities for Indigenous NDIS participants at 30 June 2019, were an intellectual disability (30%) and autism (28%).
- An evaluation into the performance of the NDIS in the Barkly region of the Northern Territory found that the NDIS was viewed as not having adapted sufficiently to address the specific needs of the Barkly region and the individualised approach of the NDIS was considered inappropriate when working with Aboriginal and Torres Strait Islander people with disability.
- A recent study of current literature about Indigenous people with disability concluded that many disability services do not adequately consider the cultural needs of Indigenous people or communicate in a culturally appropriate manner, and more work is needed to align disability services with culturally appropriate support to provide better health outcomes.
Why is it important?
A disability may be an impairment of body structure or function, a limitation in activities and/or a restriction in a person’s participation in specific activities. A person’s functioning involves an interaction between health conditions, environmental and personal factors. Aboriginal and Torres Strait Islander people are at greater risk of disability due to increased exposure to factors such as low birthweight, chronic disease, preventable disease and illness (for example, otitis media and acute rheumatic fever), injury and substance use. Along with limited access to early treatment and rehabilitation services, these factors increase a person’s risk of acquiring disability. Such factors tend to be more prevalent in populations in which there is a higher unemployment rate, lower levels of income, poorer diet and living conditions, and poorer access to adequate health care.
The National Agreement on Closing the Gap (the National Agreement), aims to ensure Indigenous Australians with disability are centred in national policies, programs and reforms, and investments across all targets and Priority Reforms are accessible, inclusive and equitable for Indigenous Australians with disability.
Data findings
Disability prevalence: findings from ABS survey data
There are 2 main surveys that provide data on Indigenous Australians with disability, the Australian Bureau of Statistics’ (ABS) Survey of Disability, Ageing and Carers (SDAC), and the National Aboriginal and Torres Strait Islander Health Survey (NATSIHS) (see Box 1.14-1: Sources of disability data).
Based on data from the 2018 SDAC, 24% of Indigenous Australians had disability in 2018 (139,700 out of an estimated 581,400 people), similar to the proportion in 2015 (ABS 2021). An estimated 8.8% of Indigenous Australians had severe or profound disability (51,100 people), meaning they need help or supervision always (profound) or sometimes (severe) to perform activities that most people undertake at least daily – core activities of self-care, mobility and/or communication.
Based on age-standardised rates, Indigenous Australians were 1.9 times as likely to have disability as non-Indigenous Australians, according to the 2018 SDAC data (ABS 2021).
The 2018–19 NATSIHS collected data on disability for those aged 15 and over. In 2018–19, of Indigenous Australians aged 15 and over, 46% (248,100 out of 536,300 people) reported they had disability, similar to the proportion reported in the 2014–15 National Aboriginal and Torres Strait Islander Social Survey (NATSISS) (45%) (Table D1.14.18). The rate of disability was the same for Indigenous males and females aged 15 and over (both 46%) (Table D1.14.4).
The estimated total proportion of Indigenous Australians with disability based on the NATSIHS (and NATSISS) is higher than those from the SDAC. ABS analysis indicates that this difference is because the NATSIHS identifies some people as having a restrictive long-term health condition who in the SDAC would be defined as having a non-restrictive long-term health condition (and therefore excluded from the SDAC disability estimates) (ABS 2019). Fewer questions are used in the NATSIHS to establish disability status and it cannot provide the same accuracy as the SDAC, which is a large survey specifically designed to collect a precise definition of disability (see also Box 1.14-1: Sources of disability data). However, the NATSIHS allows for more detailed analysis of the health, social and economic characteristics of people reporting disability than the SDAC.
The four most common self-reported disability types for Indigenous Australians were physical disabilities (63% of those with disability; 156,500 people), sight/hearing/speech disabilities (47%; 116,500), psychological disabilities (23%; 56,400) and intellectual disabilities (18%; 45,000) (Table D1.14.4, Table D1.14-1).
Table 1.14-1: Disability type for Indigenous Australians aged 15 and over with disability, by age group, 2018–19
|
Disability type |
15–24 |
25–34 |
35–44 |
45–54 |
55–64 |
65+ |
Total |
|---|---|---|---|---|---|---|---|
|
Sight/hearing/speech |
39.4% |
30.3% |
39.5% |
57.9% |
56.8% |
61.1% |
47.0% |
|
Physical |
40.6% |
57.0% |
70.1% |
69.9% |
74.3% |
73.9% |
63.1% |
|
Intellectual |
29.8% |
22.5% |
16.9% |
15.2% |
12.9% |
6.7% |
18.1% |
|
Psychological |
23.5% |
23.7% |
26.5% |
28.0% |
20.4% |
8.6% |
22.7% |
|
Head injury, stroke or brain damage |
2.3%† |
2.3%† |
4.7%† |
4.4%† |
5.3%† |
3.8%† |
3.4% |
|
Other |
18.1% |
20.2% |
27.5% |
37.1% |
41.5% |
44.6% |
30.2% |
|
Total number with disability or long-term conditions |
51,955 |
42,603 |
38,532 |
42,767 |
41,150 |
31,371 |
248,082 |
|
Total with disability |
100.0% |
100.0% |
100.0% |
100.0% |
100.0% |
100.0% |
100.0% |
† Proportion has a relative standard error between 25% and 50% and should be used with caution.
Note: More than one disability type may be reported and thus the sum of the components may add to more than the total.
Source: Table D1.14.4. AIHW and ABS analysis of the National Aboriginal and Torres Strait Islander Health Survey 2018–19.
Around 9% (47,500) of Indigenous Australians aged 15 and over had a profound or severe core activity limitation according to the 2018–19 NATSIHS, and 17% (93,300) reported a moderate or mild core activity limitation. A further 7% (38,100) reported they had disability that only restricted their engagement with school and/or employment activities (Table D1.14.4, Figure 1.14.1).
Figure 1.14.1: Disability status of Indigenous Australians aged 15 and over, 2018–19
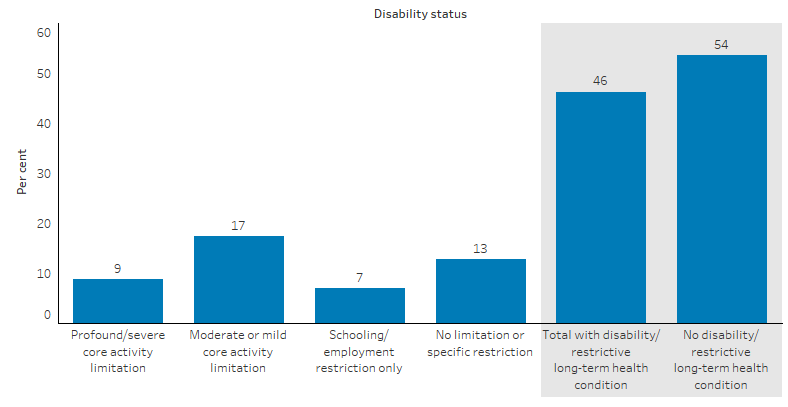
Note: 'No limitation or specific restriction' includes persons living with an impairment but having no limitation or specific restriction with everyday activities of mobility, self-care and communication or schooling/employment.
Source: Table D1.14.4. AIHW and ABS analysis of National Aboriginal and Torres Strait Islander Health Survey 2018–19.
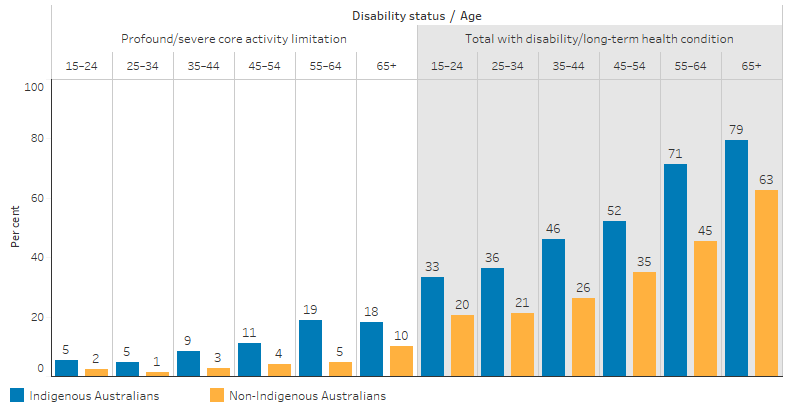
Based on the 2018–19 NATSIHS, after adjusting for differences in the age structure between the two populations, Indigenous Australians were 1.5 times as likely as non‑Indigenous Australians to have disability (51% and 34%, respectively) and 2.6 times as likely to have a profound/severe core activity limitation (10% and 4%, respectively) (Table D1.14.3).
The rate of having any type of disability for Indigenous Australians increased with age, ranging from 33% of those aged 15–24 to 79% of those aged 65 and over. The prevalence of disability was significantly higher for Indigenous Australians in all age groups compared with that of non-Indigenous Australians (Table D1.14.3, Figure 1.14.2).
Figure 1.14.2: Disability status of people aged 15 and over, by Indigenous status and age, 2018–19
Source: Table D1.14.3. AIHW and ABS analysis of National Aboriginal and Torres Strait Islander Health Survey 2018–19 and National Health Survey 2017–18.
Of Indigenous Australians aged 15–64 who were studying in 2018–19 and had disability, 41% (14,300) reported they had difficulty pursuing their education. Employment difficulties were reported by 50% (107,800) of Indigenous Australians aged 15–64 with disability or a restrictive long-term health condition (Table D1.14.5).
In 2018–19, 35% of Indigenous Australians aged 15 and over who reported having disability were employed, compared with 56% of Indigenous Australians who did not report having disability. Indigenous Australians with disability were more likely than those without disability to be living in households in the lowest income quintile (46% compared with 33%, respectively), and to have had problems accessing services (53% and 33%, respectively) (Table D1.14.28).
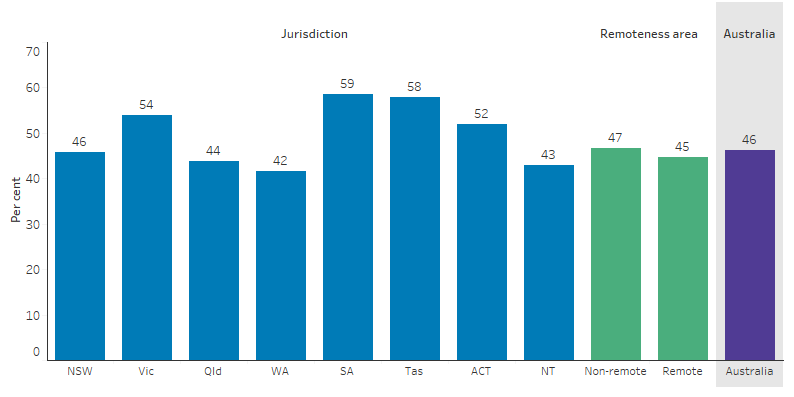
The self-reported rate of disability was the lowest for Indigenous Australians in Western Australia (42%) and highest in Tasmania (58%) based on the 2018–19 NATSIHS. The rate was similar across remoteness areas (47% in non-remote areas and 45% in remote areas) (Table D1.14.2, Figure 1.14.3).
Figure 1.14.3: Indigenous Australians aged 15 and over reporting disability, by jurisdiction and remoteness, 2018–19
Source: Table D1.14.2. AIHW and ABS analysis of National Aboriginal and Torres Strait Islander Health Survey 2018–19.
Severe or profound disability prevalence: Findings from Census data
The ABS Census of Population and Housing collects data on a subset of people with disability, specifically those needing assistance with core activities (equivalent to severe or profound disability as collected in the NATSIHS) (see also Box 1.14-1: Sources of disability data).
In 2021, 8.6% (about 66,400) of the total Indigenous population were identified as needing assistance with core activities (self-care, mobility or communication) some or all the time (Table D1.14.10). This proportion was 9.3% among males, compared with 7.9% for females.
Based on the 2021 Census, among Indigenous Australians:
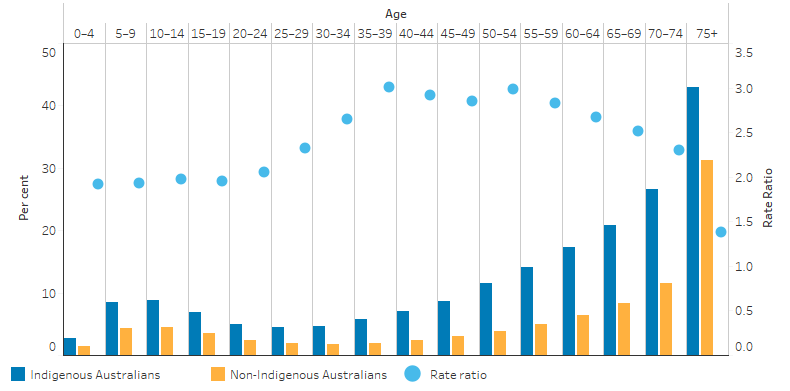
- 2.7% of children aged 0–4 needed assistance with core activities, increasing to 8.5% and 8.8% of children aged 5–9 and 10–14, respectively.
- in age groups between 15–19 to 40–44, the proportion who needed assistance with core activities varied between 4.5% and 7.0%.
- for those aged between 45–49 to 75 and over, the proportion who needed assistance with core activities increased with age, from 8.7% to 43% (Table D1.14.10, Figure 1.14.4).
While broadly similar patterns by age were seen among non-Indigenous Australians, the proportion of Indigenous Australians who needed assistance with a core activity was higher in all age groups when compared with non-Indigenous Australians. The increasing prevalence with age also began earlier for Indigenous Australians (from around age 30) than for non-Indigenous Australians (from around age 40) (Table D1.14.10, Figure 1.14.4). The relative difference in rates for Indigenous and non-Indigenous Australians was highest between the ages 35 and 59 (rate ratios between 2.8 and 3.0).
Figure 1.14.4: People needing assistance with core activities, by Indigenous status and age group, 2021
Source: Table D1.14.10. AIHW and ABS analysis of Census of Population and Housing 2021.
Across jurisdictions, the proportion of Indigenous Australians who reported needing assistance with a core activity in 2021 varied between 5.5% in the Northern Territory to 10.4% in Victoria (Table D1.14.12).
In 2021, the proportion of Indigenous Australians with a core activity need for assistance ranged from 4.3% in Very remote areas and 9.7% in Inner regional areas (Table D1.14.11).
In 2021, the proportion of Indigenous Australians needing assistance with core activities was 2.1 times as high as for non-Indigenous Australians, based on age-standardised rates (Table D1.14.12).
Social and cultural connections
A feature article from the 2014–15 NATSISS presented findings on the lived experiences of Indigenous Australians who had disability or a long-term restrictive condition. Indigenous Australians with disability experience difference across many areas related to family and community connections, compared with those with no disability. Connections to culture, family and the community, along with engagement in cultural activities, are important in reducing isolation and improving access to supportive networks (ABS 2016).
In 2014–15, the proportion of Indigenous Australians who reported they recognised their homelands or traditional Country, identified with a clan, tribal group or language group and/or spoke an Indigenous language was similar for those who had disability and those who did not. Reporting participation in cultural events was also similar, regardless of disability status.
Indigenous Australians with severe or profound disability were less likely to have had daily face-to-face contact with family or friends outside their household, compared with those with no disability (35% compared with 45%).
In 2014–15, Indigenous Australians with severe or profound disability were less likely to have received support in a time of crisis from a family member (78%) or friend (55%) from outside their household, compared with those who did not have disability (85% and 64%, respectively). However, they were more likely to have received crisis support from community, charity or religious organisations (20%) or health, legal or financial professional (15%) than those with no disability (12% and 8%, respectively) (ABS 2016).
Unpaid carers
The ABS Census of Population and Housing 2021 collected data on those who provided care for family members or others. In 2021, 15% (76,600) of Indigenous Australians aged 15 and over provided unpaid assistance to a person with disability, long-term health conditions or problems related to ageing (excluding those for whom carer status was not stated). By age group, the proportion of Indigenous Australians who were providing unpaid care was highest for those aged 45–54 (21%), followed by those aged 35–44 and 55–64 (both 20%) (Table D1.14.15).
Indigenous females were more likely to be providing unpaid care than Indigenous males – 18% compared with 12% (AIHW analysis of ABS 2023).
After adjusting for differences in the age structure between the two populations, the proportion of Indigenous Australians providing unpaid care to a person with disability, long-term health condition or problems related to old age was 1.3 times the proportion for non-Indigenous Australians (Table D1.14.15).
In 2021, of Indigenous Australians who provided unpaid assistance to a person with disability, long-term health condition or problems related to ageing, 48% (36,300) were employed, 8.0% (6,000) were unemployed, and 44% (33,800) were not in the labour force. Indigenous Australians providing unpaid assistance were slightly less likely to be in the labour force than those who did not provide unpaid care (56% compared with 58%) (Table D1.14.26). From 2011 to 2021, the median weekly income of Indigenous carers providing unpaid assistance to a person with disability, long-term illness or problems related to old age increased from $359 to $563 (Table D1.14.27).
Disability support services
Specialist disability support services are now largely provided through the NDIS. Most, but not all, National Disability Agreement (NDA) services, and the people using them, have transitioned to the NDIS. Information on the use of services provided under the NDA was previously collected annually in the Disability Services National Minimum Data Set, with 2018–19 being the last year of collection under this data set.
In 2018–19, 12,079 Indigenous Australians were receiving services under the NDA, 5.5% of all users (excluding those for whom Indigenous status was not stated) (AIHW 2020). The majority (78%) of Indigenous service users were aged under 50, 21% were aged 50–64, and 1% were aged 65 and over. Indigenous service users were generally younger than non-Indigenous service users, with an average age of 35, compared with 40 for non-Indigenous users.
National Disability Insurance Scheme
As at 31 December 2022, 42,679 Indigenous Australians were participating in the NDIS (7.4% of all participants) – an increase from 36,050 in December 2021 (National Disability Insurance Agency 2023b).
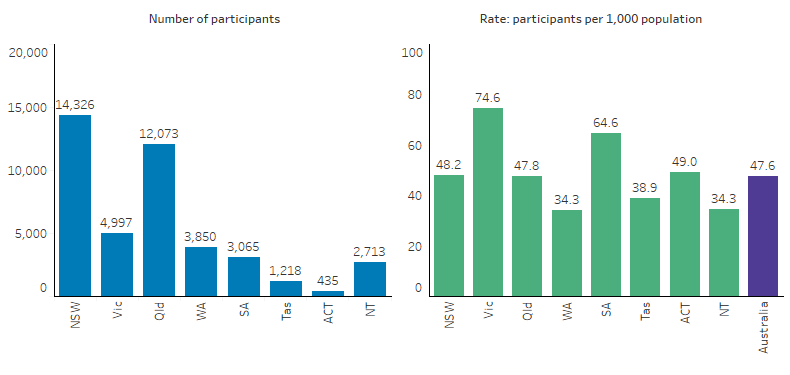
New South Wales and Queensland had the largest number of Indigenous NDIS participants (14,326 and 12,073, respectively) – these are also the jurisdictions with the largest Indigenous populations. As a population rate, Victoria had the highest rate of NDIS use among Indigenous Australians (75 per 1,000 population), followed by South Australia (65 per 1,000 population) (Figure 1.14.5).
Figure 1.14.5: Indigenous NDIS participants, by jurisdiction, 31 December 2022
Note: Rates calculated using ABS projections of the Indigenous population at 30 June 2022 (series B) based on the 2016 Census of Population and Housing.
Source: AIHW analysis of National Disability Insurance Agency 2023b.
Among the Indigenous NDIS participants on 31 December 2022, the average annualised committed support was $74,000, similar to that for all participants ($73,900) (National Disability Insurance Agency 2023b). The average annualised committed support is calculated using participants’ support budget converted to a yearly rate and divided by the number of participants (rounded to the nearest thousand dollars). Note that not all committed support may have been accessed or used by participants.
In Remote and very remote areas, the average annualised committed support for Indigenous NDIS participants was $105,000 (National Disability Insurance Agency 2023a). People with disability in remote communities, along with their families and carers, can face particular challenges such as limited service choice and availability, the need for travel and transportation, and difficulties with recruiting, training and retaining professionals (National Disability Insurance Agency 2016).
More detailed data on Indigenous NDIS participants are available for the period ending 30 June 2019 (National disability Insurance Agency 2019). As at 30 June 2019, the most common primary disabilities for Indigenous participants were intellectual disability (30%) and autism (28%). For non-Indigenous participants, these were also the two most common primary disabilities–27% and 31%, respectively.
The majority of Indigenous NDIS participants were aged under 25 (65%), compared with 54% of non-Indigenous participants.
Indigenous participants were less likely to be living in Major cities than non-Indigenous participants (43% compared with 68%, respectively), and more likely than non-Indigenous participants to live in Remote and very remote areas (11% compared with 1%, respectively).
Supported Independent Living arrangements (help with and/or supervision of daily tasks) were included in the plans of 6% of Indigenous participants aged under 25 and 15% of those aged 25 and over, similar to the proportions for non-Indigenous Australians (7% and 15%, respectively).
Indigenous participants utilised less of the committed supports in their plans than non-Indigenous participants–60% compared with 67%, respectively (National disability Insurance Agency 2019).
Research and evaluation findings
Survey and administrative data have shown a higher rate of disability across the life course for Indigenous Australians. Research highlights the characteristics, determinants and effects of disability and can provide insight into the experiences of disability across life stages. For example:
- One study focused on family and cultural inclusion as essential components of healthy child development (Gilroy & Emerson 2016). The research analysed data collected in Wave 4 of Footprints in Time: The Longitudinal Study of Indigenous Children, and found that Indigenous children with low cognitive ability are at a higher risk of social exclusion than their peers.
- Another study found that frailty, or physiological decline in later life, is substantially higher in Indigenous Australians living in Remote areas than in other populations (Hyde et al. 2016).
A study examined both peer-reviewed and grey literature focusing on access to services that increase the likelihood of Indigenous Australians with disability to live independent and socially inclusive lives (Gilroy et al. 2017). The study aimed to identify methods to develop workforce capacity to better deliver NDIS services to Indigenous Australians with disabilities in rural and remote areas. The study identified:
- significant access and equity barriers to culturally appropriate disability support services,
- the importance of strategies to attract, develop and retain Indigenous workers in the Indigenous disability workforce,
- the importance of culturally safe disability services and community-centred principles, and
- the importance of strategies such as cultural training for workforce development.
The study also identified the importance of maximising possible benefits from disability sector reforms for Indigenous Australians with disabilities.
People with disability living in rural and remote areas often face additional challenges that are distinctly different from those faced by people who live in metropolitan areas. A Department of Social Services (DSS) evaluation published in 2018 on the performance of the NDIS in the Barkly region (NT) found the prevalence of disability and associated health and social support needs were high in the area. The number of actual participants in the NDIS, however, was felt to be an underestimate of these high levels of disability. While attempts were made over time to adapt NDIS processes to local need, by the end of the evaluation period it was still felt that both the approach and implementation of the NDIS trial in the NT had been ineffective. In particular, the NDIS was not perceived to have adapted sufficiently to address the specific needs of the Barkly region and the individualised approach of the NDIS was considered inappropriate when working with Indigenous people with disability. The adoption of a model which was more culturally sensitive and appropriate to remote needs and service delivery was recommended (Mavromaras et al. 2018).
A recent meta-synthesis of current literature about Indigenous people with disability concluded that many disability services do not adequately consider the cultural needs of Indigenous people or communicate in a culturally appropriate manner. More work is needed to align disability services with culturally appropriate support to provide better health outcomes (James et al. 2023).
Implications
Although disability prevalence varies across data sources, all show a higher disability rate experienced by Indigenous Australians than non-Indigenous Australians. The high levels of disability and earlier onset of core activity restrictions experienced by Indigenous Australians are consistent with the higher levels of disease and injury, and lower access to health services relative to need. There is a clear link between disability and socioeconomic disadvantage (Kavanagh et al. 2013; VicHealth 2012). Lower levels of educational attainment, lower participation in the workforce and lower income are likely to be both the cause and consequence of disability (Biddle 2013). High proportions of Indigenous Australians with disability experiencing difficulties in pursuing education or employment are of concern.
Australia’s Disability Strategy 2021-2031 (the Strategy) recognises the importance of adopting an intersectional approach that meaningfully addresses the lived experiences of cohorts. The Strategy does not assume experience and impact of disability is the same. Under the Strategy, all levels of government are committed to adopting an intersectional approach to the development and implementation of policy priorities - tailoring responses to meet the needs of cohorts, with Indigenous people with disability a priority cohort.
The Disability Sector Strengthening Plan under the National Agreement on Closing the Gap, developed with the First Peoples Disability Network (FPDN) and the Commonwealth Government, aims to provide significant Indigenous disability sector reform and strengthen the community-controlled sector. This plan aims to support community organisations to operationalise disability as a cross-cutting outcome for all socio-economic targets under the National Agreement.
The NDIS provides beneficial services and support for Indigenous people with disability, however the Disability Royal Commission has found that Indigenous people in remote and very remote areas face barriers to access and fully participate in the NDIS. The limited availability of service providers in these areas, including culturally appropriate services and a limited Indigenous disability workforce, results in accessibility and service gaps and often the need to move off Country (Disability Royal Commission 2021). The NDIA is partnering with the FPDN to co-design a new First Nations Strategy and action plan that reflects the priority issues and opportunities to achieve outcomes for Indigenous people with disability on an equal basis with the broader population.
The Policy Context is at Policies and Strategies.
References
- ABS (Australian Bureau of Statistics) 2016. National Aboriginal and Torres Strait Islander Social Survey 2014–15. Cat. no. 4714.0. Canberra.
- ABS 2019. Sources of Data for Aboriginal and Torres Strait Islander Peoples with Disability, 2012-2016.
- ABS 2021. Aboriginal and Torres Strait Islander people with disability. ABS. Viewed 23 June 2023.
- ABS 2023. 2021 Census Community Profiles, Aboriginal and Torres Strait Islander peoples profile, Australia. Canberra: ABS. Viewed 23 June 2023.
- AIHW (Australian Institute of Health and Welfare) 2020. Disability support services: services provided under the National Disbility Agreement 2018–19. Canberra: AIHW.
- Biddle N 2013. CAEPR Indigenous Population Project 2011 Census Papers. Canberra: CAEPR.
- Disability Royal Commission 2021. Overview of responses to the Experience of First Nations people with disability in Australia Issues paper.
- Gilroy J, Dew A, Lincoln M & Hines M 2017. Need for an Australian Indigenous disability workforce strategy: review of the literature. Disability and Rehabilitation 39:1664-73.
- Gilroy J & Emerson E 2016. Australian indigenous children with low cognitive ability: Family and cultural participation. Research in Developmental Disabilities 56:117-27.
- Hyde Z, Flicker L, Smith K, Atkinson D, Fenner S, Skeaf L et al. 2016. Prevalence and incidence of frailty in Aboriginal Australians, and associations with mortality and disability. Maturitas 87:89-94.
- James MH, Prokopiv V, Barbagallo MS, Porter JE, Johnson N, Jones J et al. 2023. Indigenous experiences and underutilisation of disability support services in Australia: a qualitative meta-synthesis. Disabil Rehabil:1-12.
- Kavanagh AM, Krnjacki L, Beer A, Lamontagne AD & Bentley R 2013. Time trends in socio-economic inequalities for women and men with disabilities in Australia: evidence of persisting inequalities. International Journal for Equity in Health 12:73.
- Mavromaras K, Moskos M, Mahuteau S & Isherwood L 2018. Evaluation of the NDIS: final report. Department of Social Services. South Australia: National Institute of Labour Studies. Flinders University.
- National Disability Insurance Agency 2016. Rural and Remote Strategy, 2016-2019.
- National disability Insurance Agency 2019. NDIS Aboriginal and Torres Strait Islander participants 30 June 2019. NDIA.
- National Disability Insurance Agency 2023a. Data downloads, First Nations participants. Viewed June 2023.
- National Disability Insurance Agency 2023b. NDIS Quarterly report to disability ministers 31 December 2022. NDIA.
- VicHealth 2012. Disability and health inequalities in Australia: Addressing the social and economic determinants of mental and physical health. Melbourne: VicHealth.

