
Life expectancy
In 2020–2022, life expectancy at birth was estimated to be 71.9 years for First Nations males and 75.6 years for First Nations females. The gap between First Nations people and non-Indigenous Australians was estimated to be 8.8 years for males and 8.1 years for females (Table 4.1) (ABS 2023b).
Table 4.1: Life expectancy at birth (age-adjusted), by Indigenous status and sex, 2020–2022
|
|
Years |
|---|---|
|
First Nations males |
71.9 |
|
Non-Indigenous males |
80.6 |
|
Difference in years |
8.8 |
|
First Nations females |
75.6 |
|
Non-Indigenous females |
83.8 |
|
Difference in years |
8.1 |
Source: Table 1 – Australian Bureau of Statistics (ABS 2023b).
First Nations males and females living in Remote and very remote areas have the lowest life expectancy, while the highest was in Inner and outer regional areas, followed closely by Major cities. First Nations males and females living in Remote and very remote areas have a life expectancy around 5 years lower than those in Major cities, and Inner and outer regional areas. The largest difference in life expectancy between First Nations people and non-Indigenous Australians was in Remote and very remote areas, with a difference of 12.4 years (for both males and females) (Figure 4.1).
Figure 4.1: Life expectancy at birth (age-adjusted), by remoteness and sex, 2020–2022
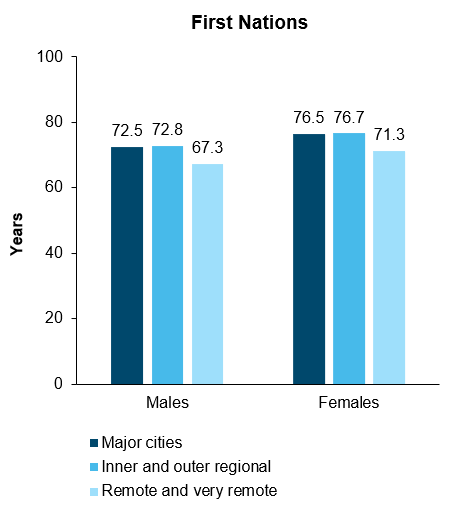
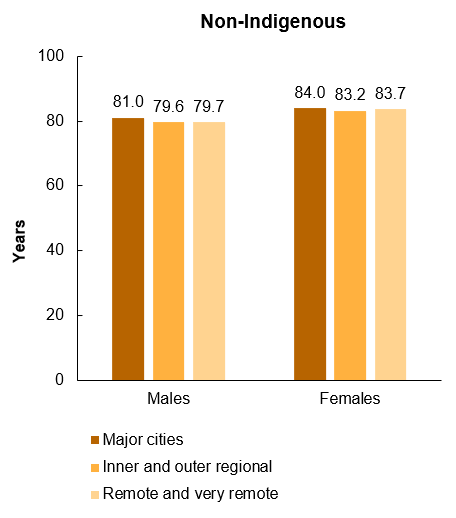
Notes1. ‘Regional’ includes Inner regional and Outer regional areas, ‘Remote’ includes Remote and Very remote areas.
2. Life expectancy estimates are calculated taking age-specific identification rates into account.
Source: Table 3 – Australian Bureau of Statistics (ABS 2023b).
First Nations males living in the most socioeconomically disadvantaged areas have a life expectancy (age-adjusted) that is about 5.1 years lower than those living in the least disadvantaged areas. First Nations females in the most disadvantaged areas had a life expectancy of around 3 years lower than those in the least disadvantaged areas (Figure 4.2).
Figure 4.2: Life expectancy at birth (age-adjusted) for First Nations people, by socioeconomic area and sex, 2020–2022
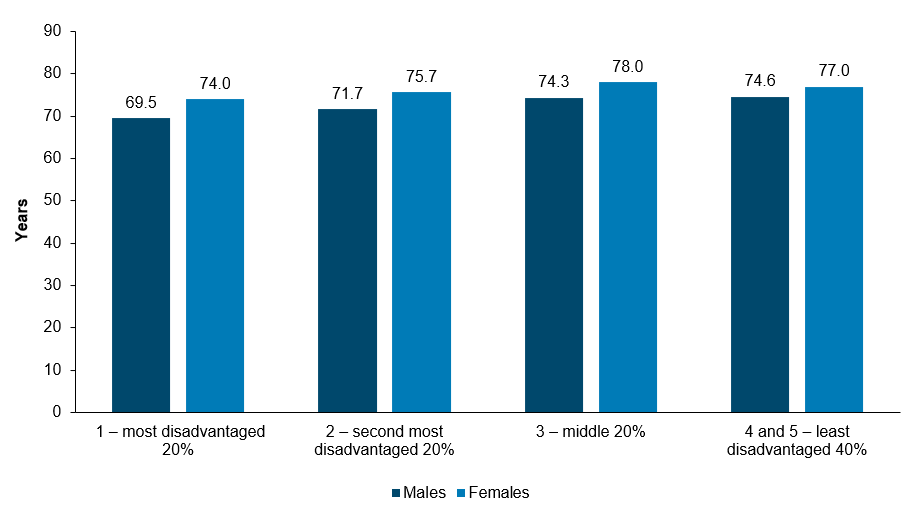
Notes
1. Socieconomic area is based on the Index of Relative Socio-Economic Disadvantage (IRSD). A low IRSD score indicates relatively greater disadvantage, and a high score indicates a relative lack of disadvantage. Quintile 1 contains the lowest 20% of scores (the most disadvantaged areas), and quintile 5 contains the highest 20% of scores (the least disadvantaged areas).
2. Life expectancy estimates are calculated taking age-specific identification rates into account.
Source: Table 3 – Australian Bureau of Statistics (ABS 2023b).
For further information, see: