
Employment
In 2021, 52% (253,600) of First Nations people aged 15–64 (working age) were employed. The employment rate for First Nations people at working age was highest in Major cities at 58% and the lowest in Very remote areas at 32%. The employment rate was lower for First Nations people in remote areas (Remote and Very remote areas combined) and decreased from less remote areas to more remote areas (Figure 5.4).
First Nations people aged 15–64 had a lower employment rate than non-Indigenous Australians (52% compared with 75%), and this was true across all age groups (Figure 5.4). The gap in employment rates between First Nations people and non-Indigenous Australians aged 15–64 was higher in more remote areas, ranging from 17% in Major cities to 47% in Remote and very remote areas (Figure 5.4).
Figure 5.4: Employment rate (people aged 15–64), by Indigenous status and age group, and by Indigenous status and remoteness, 2021
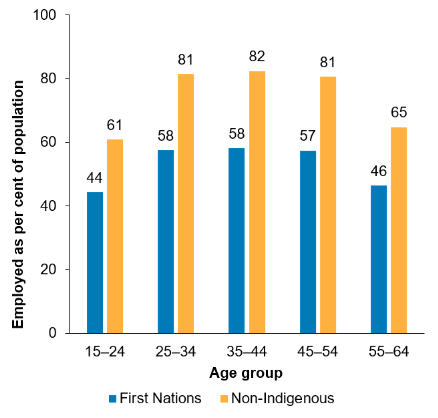
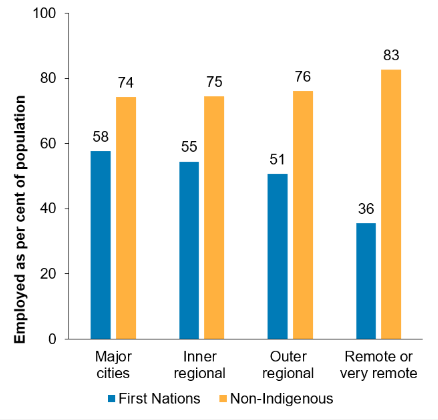
Source: Measure 2.07, Table D2.07.3 and Table D2.07.6. AIHW analysis of ABS Census of Population and Housing 2021 (ABS 2022a).
For First Nations people aged 25–64 (the target age group for the employment Closing the Gap target), the employment rate increased from 51% in 2016 to 56% in 2021. Between 2016 and 2021, the gap in the employment rates between First Nations people and non-Indigenous Australians aged 25–64 narrowed from 24.7 to 22.0 percentage points.
The employment rate for First Nations people aged 25–64 increased with each level of educational attainment. From 24% of those with no educational attainment or a Year 9 or below qualification combined, 45% of those with a secondary education at a Year 10 to 12 level, 72% of those with a Certificate III or IV level qualification, and 85% of those with a bachelor’s degree as their highest level of education were employed in 2021 (Table 5.1).
Table 5.1: Employment rate (%) for First Nations people aged 25–64, by highest level of educational attainment and remoteness, 2021
|
|
Bachelor Degree Level or higher |
Advanced Diploma and Diploma Level |
Certificate III and IV Level |
Year 10 to 12 |
Certificate I & II Level |
Year 9 or below/no education attainment |
Total |
|---|---|---|---|---|---|---|---|
|
Major cities |
86 |
76 |
72 |
52 |
30 |
28 |
62 |
|
Inner regional |
84 |
76 |
73 |
48 |
32 |
28 |
58 |
|
Outer regional |
84 |
76 |
73 |
45 |
34 |
25 |
54 |
|
Remote |
85 |
80 |
75 |
37 |
46 |
20 |
46 |
|
Very Remote |
82 |
78 |
64 |
30 |
48 |
17 |
35 |
|
Australia |
85 |
76 |
72 |
45 |
34 |
24 |
56 |
Note: Total includes people for whom educational attainment was inadequately described or not stated.
Source: Measure 2.07, Table D2.07.22. AIHW analysis of ABS Census of Population and Housing 2021 (ABS 2022a).
First Nations people aged 25–64 with one or more long-term health conditions and who needed assistance with core activities had lower employment rates than those with no long-term condition, and those who did not need assistance. The employment rate:
- ranged from 17% to 53% for those with one or more long-term health conditions, compared with 65% for those with no long-term condition
- was 14% for those who needed assistance with core activities, compared with 62% for those who did not need assistance.
Many First Nations people face conflicts between their family responsibilities and the challenges of finding and maintaining employment (Venn & Biddle 2018). A recent study found that education, disability, and having spent time in prison were the most important factors underlying labour force participation (Dinku & Hunt 2021).
A lack of available jobs or not having a driver’s licence, among others, were reported as barriers in finding work. Among First Nations people aged 15–64 who were unemployed in 2014–15:
- Nearly 2 in 5 (38%) in remote areas reported a lack of any jobs as a barrier to finding work, compared with 1 in 5 (22%) unemployed First Nations people in non-remote areas.
- Nearly 1 in 5 (19%) in remote areas reported not having a driver’s licence as a barrier to finding work, compared with 1 in 3 (33%) unemployed First Nations people in non-remote areas (Table 5.2).
Table 5.2: Top 5 difficulties finding work, unemployed First Nations people aged 15–64, 2014–15
|
Remote |
Non-remote |
|---|---|
|
No jobs in local area or line of work 44% (5,700) |
No jobs in local area or line of work 38% (15,500) |
|
No jobs at all 38% (4,900) |
Don't have driver's licence 33% (13,500) |
|
Transport problems/distance 27% (3,500) |
Transport problems/distance 33% (13,300) |
|
Insufficient education, training, skills 22% (2,800) |
Insufficient education, training, skills 32% (13,000) |
|
Don't have driver's licence 19% (2,400) |
No jobs at all 22% (8,800) |
Source: Measure 2.07, Table D2.07.10 – AIHW and ABS analysis of National Aboriginal and Torres Strait Islander Social Survey 2014–15.
Transport access is closely associated with job opportunities. Lack of transport access can limit job options within a confined geographical area, create difficulties in committing to jobs with non-standard working hours, and negatively impact job performance and reliability due to long and unpredictable commute times (Rosier & McDonald 2011). In 2021, among 342,600 First Nations households, 88% owned or used at least one vehicle, while 12% did not have a motor vehicle (excluding households where the number of vehicles was not reported). The proportion of First Nations households with one or more vehicles was higher in non-remote areas (90%) compared to remote areas (68%) (AIHW analysis of ABS 2023a).
For further information, see: