Key messages
- Between 2016 and 2021, the employment rate for Aboriginal and Torres Strait Islander people aged 15–64 increased from 47% to 52%, based on the Census of Population and Housing. The employment rate was lower in more remote areas. In 2021, the employment rate for Indigenous Australians aged 15–64 was highest in Major cities at 58% and the lowest in Very remote areas at 32%. For Indigenous Australians aged 25–64 (Closing the Gap target), the employment rate increased from 51% to 56% between 2016 and 2021, and the gap between Indigenous and non-Indigenous employment rates reduced from 24.7 to 22.0 percentage points.
- The unemployment rate is defined as the number of people who are unemployed, as a proportion of those in the labour force – between 2016 and 2021, the unemployment rate for Indigenous Australians aged 25–64 decreased from 15.0% to 10.0%, as did the gap between Indigenous and non-Indigenous unemployment rates (from 9.7 percentage points to 6.0 percentage points).
- In 2021, 60% of Indigenous Australians aged 15–64 were participating in the labour force (that is, employed or unemployed and looking for work) (289,700 people), and 52% were employed (253,600 people). Across the states and territories, the employment rate for Indigenous Australians aged 15–64 ranged from 31% Northern Territory to 69% in Australian Capital Territory.
- The proportion of Indigenous Australians aged 15–24 who were fully engaged in employment, education or training increased from 57% in 2016 to 58% in 2021.
- The employment rate was lower in more remote areas. In 2021, the employment rate for Indigenous Australians aged 15–64 was highest in Major cities at 58% and the lowest in Very remote areas at 32%.
- According the 2014–15 National Aboriginal and Torres Strait Islander Social Survey (NATSISS), Indigenous Australians who were unemployed faced difficulties finding work related to a lack of jobs in the local area (41% of self-reported unemployed Indigenous Australians; 21,640), transportation (32%; 17,020), lack of driver’s license (31%; 16,350) and insufficient education or training skills (30%; 15,960).
- Indigenous Australians face greater barriers to employment, including a lack of access to high-quality and relevant training, limited access to supportive workplaces, inconsistent mentoring for young Aboriginal and Torres Strait Islander job seekers and few long-term job opportunities. More frequent interactions with the justice system and remote areas also present additional barriers limiting employability and access to employment opportunities.
- Evaluations reveal that involving Indigenous Australians in program design and building culturally safe employment opportunities are effective strategies. However, there is a need to improve community control, governance structures, and communication for even better outcomes.
- Reconciliation Australia recommends that workplaces looking to improve retainment of Indigenous employees should accommodate cultural requirements that may interfere with employment, such as leave for Sorry Business or flexible work arrangements that allow for working on Country, as this supports Indigenous employees to feel culturally safe.
- The United Nations Permanent Forum on Indigenous Issues recommends that Indigenous wellbeing reporting frameworks include some recognition of the value of Indigenous work such as ‘making a living’ rather than simply ‘having a job’. It advocates including indicators that provide insight into Indigenous participation, and economic benefit from, customary or subsistence activities in addition to, instead of, or in comparison with, mainstream economic engagement.
Why is it important?
Employment and health are interconnected. Employment is beneficial for individual and community health as it boosts financial security, social status, personal development, social relations, self-esteem and emotional wellbeing (Lowry & Moskos 2007; Marmot et al. 2008).
Workforce participation rates are considerably higher for people with better health, particularly better mental health. Employment and financial security are key drivers of better mental health outcomes with employed Indigenous Australians half as likely to have high or very high levels of mental distress than those who are unemployed (Hunter et al. 2022). Culturally safe and secure employment can support broader social determinants of health and improve access to health services by increasing incomes.
A lack of cultural competency in the workplace has a substantial effect on the overall health and wellbeing of Indigenous Australian employees, including a notable detrimental impact on mental health (Evans 2021). Employment leads to a measurable reduction in suicidal behaviour for Indigenous Australians (Dudgeon et al. 2016). Employment has the capacity to break cycles of poverty and trauma that impact Indigenous Australians, especially women (Evans 2021).
While relatively poor health is a major contributor to lower labour market attachment for Indigenous Australians (Kalb et al. 2012), being disabled, or looking after someone in poor health are also barriers to labour force participation (Belachew & Kumar 2014). Indigenous Australians that live in non-remote areas tend to have higher rates of employment than those living in remote areas.
In 2020, the National Agreement on Closing the Gap outlined new targets for employment. It identifies the importance of ensuring there is strong economic participation and development for both Indigenous Australians and their communities, and to ensure Indigenous youths are engaged in employment or education.
- Target 7: By 2031, increase the proportion of Aboriginal and Torres Strait Islander youth (15–24 years) who are in employment, education or training to 67 per cent (compared with a 2016 baseline level of 57 per cent).
- Target 8: By 2031, increase the proportion of Aboriginal and Torres Strait Islander people aged 25–64 who are employed to 62 per cent (compared with a 2016 baseline level of 51 per cent).
For the latest data on the Closing the Gap targets, see the Closing the Gap Information Repository.
Employment is interconnected with other social determinants of health, such as education (see measures 2.04 Literacy and numeracy, 2.05 Education outcomes for young people and 2.06 Educational participation and attainment of adults), income (see measure 2.08 Income), and the socioeconomic environment (see measure 2.09 Socioeconomic indexes).
Data findings
Labour force participation and employment
Data presented in this section are from the 2021 ABS Census of Population and Housing. People for whom labour force status was not stated were excluded prior to calculating percentages.
Note that the Census was held on 10 August 2021, during which most states and territories in Australia were under restrictions due to the COVID-19 pandemic.
In the 2021 Census, information on labour force status was collected for around 485,500 Aboriginal and Torres Strait Islander people aged 15–64. Based on these data, about 289,700 (60%) Indigenous Australians aged 15–64 were in the labour force, consisting of:
- 253,600 (52% of those aged 15–64) who were employed
- 36,000 (7%) who were looking for work (unemployed) (Table D2.07.3).
The labour force participation rate was slightly higher for Indigenous males than females (62%, compared with 58%) (Table D2.07.4, Figure 2.07.1).
Figure 2.07.1: Labour force status, Indigenous Australians aged 15–64, by sex, 2021
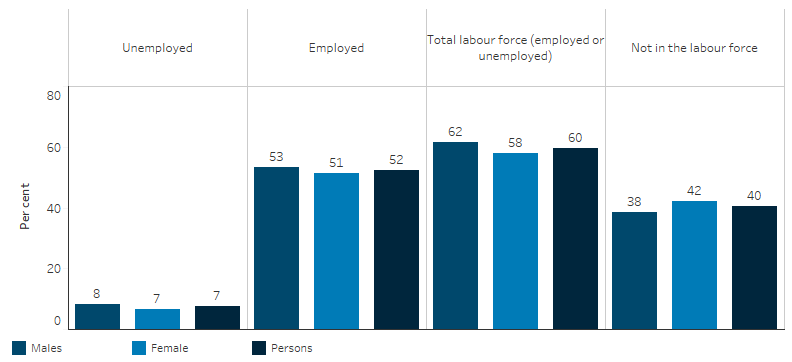
Note: Data shown are calculated using the total number of Indigenous Australians aged 15–64 as the denominator, excluding those for whom labour force status was unknown. The proportion who were unemployed as presented in this figure differs to the ‘unemployment rate’ which is calculated using the number of Indigenous Australians aged 15–64 in the labour force as the denominator (see ‘Unemployment rate’ section).
Source: Table D2.07.4. AIHW analysis of ABS Census of Population and Housing (ABS 2022a).
Among Indigenous Australians aged 15–64:
- the labour force participation rate was highest for those aged 25–34 and 35–44 (both 65%), as were employment rates (both 58%),
- those aged 55–64 had the lowest labour force participation rate (51%), followed by those aged 15–24 (54%), and
- younger people aged 15–24 had the lowest employment rate (44%), followed by those aged 55–64 (46%) (Table D2.07.3, Figure 2.07.2).
Figure 2.07.2: Employment and labour force participation rate, Indigenous Australians aged 15–64, by age group, 2021
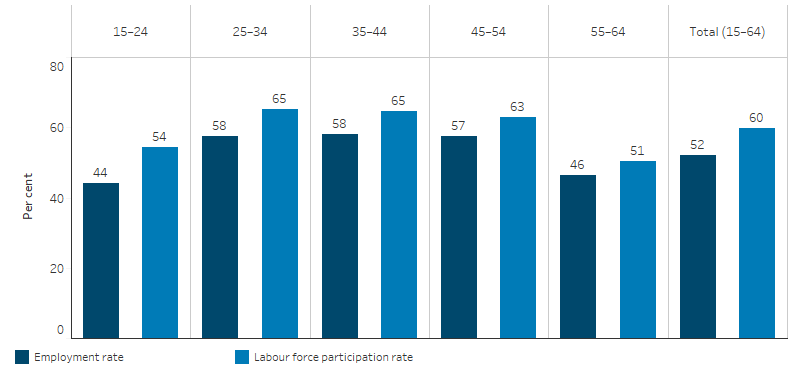
Note: Data shown are calculated using the number of Indigenous Australians in the specified age group as the denominator, excluding those for whom labour force status was unknown.
Source: Table D2.07.3. AIHW analysis of ABS Census of Population and Housing (ABS 2022a).
Across the states and territories, the employment rate for Indigenous Australians aged 15–64 in 2021 ranged from 31% in Northern Territory to 69% in Australian Capital Territory (Table D2.07.5, Figure 2.07.3).
Figure 2.07.3: Employment rate, Indigenous Australians aged 15–64, by jurisdiction, 2021
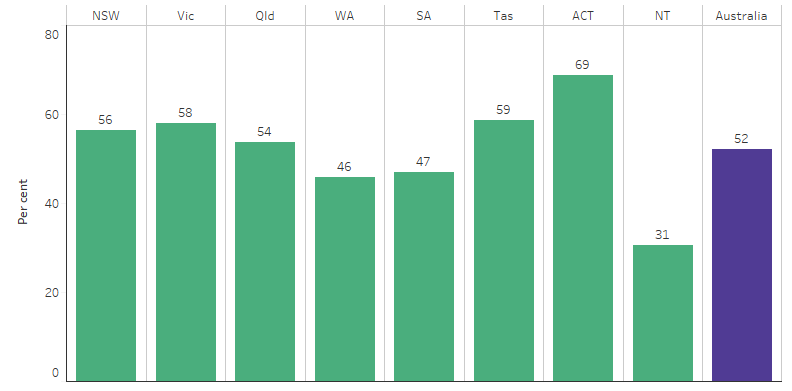
Note: Data are calculated using the number of Indigenous Australians aged 15–64 in the specified jurisdiction as the denominator, excluding those for whom labour force status was unknown.
Source: Table D2.07.5. AIHW analysis of ABS Census of Population and Housing (ABS 2022d).
In 2021, the employment rate for Indigenous Australians aged 15–64 was highest in Major cities (58%, about 117,700 of 204,200, excluding ‘not stated’ responses). This was followed by Inner regional areas (55%, 64,500 of 118,200), Outer regional areas (51%, 44,800 of 88,500) and Remote areas (42%). The lowest employment rate was in Very remote areas at 32% (15,200 of 47,500) (Table D2.07.6, Figure 2.07.4).
Figure 2.07.4: Labour force status of Indigenous Australians aged 15–64, by remoteness, 2021
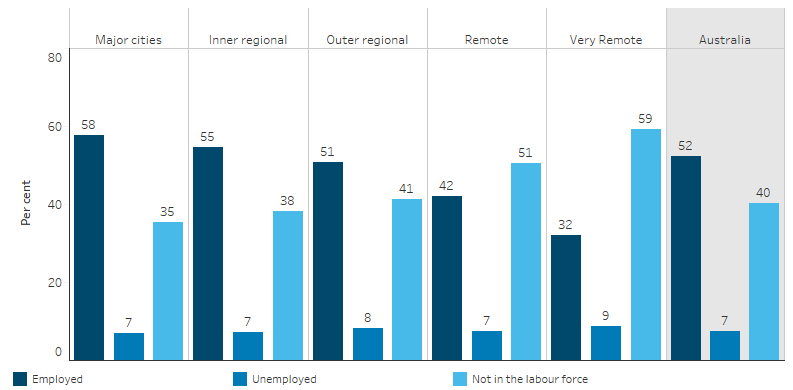
Note: Data are calculated using the number of Indigenous Australians aged 15–64 in the specified remoteness area as the denominator, excluding those for whom labour force status was unknown.
Source: Table D2.07.6. AIHW analysis of ABS Census of Population and Housing (ABS 2022d).
Of Indigenous Australians aged 15–64 in 2021 about 142,000 (29% of 485,500) were employed full-time, and about 84,400 (17% of 485,500) were employed on a part-time basis (Table D2.07.3).
Based on data from the last three censuses, the proportion of Indigenous Australians aged 15–64 who were employed was similar in 2011 to 2016 (46% and 47% respectively), increasing to 52% in 2021 (Table D2.07.18, Figure 2.07.5). For Indigenous Australians aged 25–64, the employment rate increased from 51% to 56% between 2016 and 2021 (Table D2.07.18).
Note that trends over time in employment, particularly in remote areas, may be affected by the Community Development Employment Program (CDEP), and its transition to the Community Development Program (CDP), which commenced in July 2015. People who participated in CDEP and received wages from their community were considered as employed in the 2011 Census. This changed in 2016 where people who participated in the CDP received income support payments directly from the Government and were not considered to be employed, unless they had another non-CDP job (ABS 2017).
Figure 2.07.5: Labour force status, Indigenous Australians aged 15–64, 2011, 2016 and 2021
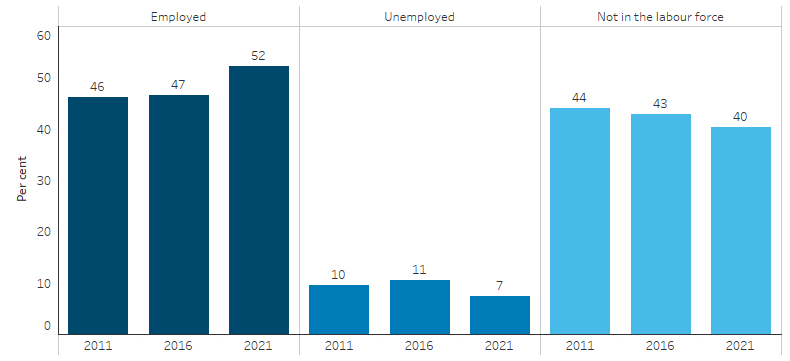
Note: Data shown are calculated using the total number of Indigenous Australians aged 15–64 as the denominator, excluding those for whom labour force status was unknown. The proportion who were unemployed as presented in this figure differs to the ‘unemployment rate’, which uses the number of Indigenous Australians aged 15–64 in the labour force as the denominator (see ‘Unemployment rate’ section).
Source: Table D2.07.18. AIHW analysis of ABS Census of Population and Housing (ABS 2022a).
Unemployment rate
‘Unemployment rate’ is defined as the percentage of the labour force who are unemployed.
Based on the 2021 Census, the unemployment rate among Indigenous Australians aged 15–64 was 12% (around 36,000 of 289,700 people, based on Census counts (Table D2.07.3). Indigenous males aged 15–64 had a higher unemployment rate than Indigenous females (13.5% compared with 11.3%) (Table D2.07.4).
Among Indigenous Australians aged 25–64, the unemployment rate was 10.0% in 2021 (about 21,100 of 209,900 people) (Table D2.07.3). The unemployment rate for indigenous males aged 25–64 was 10.8%, compared with 9.2% for females (Table D2.07.4).
Data from the 2018–19 National Aboriginal and Torres Strait Islander Health Survey show that of unemployed Indigenous Australians aged 15–64, 20,610 (42%) reported having high or very high levels of psychological distress in the past month, compared with 48,960 (22%) of those who were employed in 2018–19 (Table D2.07.13).
Reasons for not being in the labour force
In the 2014–15 National Aboriginal and Torres Strait Islander Social Survey (NATSISS), the main reasons for not looking for a job that were given by selected Indigenous Australians aged 15 and over who were not in the labour force included childcare (22%), studying or returning to study (20%) and having a long-term health condition or disability (18%) (Table D2.07.11).
Research has shown that many of those not in the labour force in remote areas are still engaged in productive activities supporting their community (Altman J.C. et al. 2005).
Health conditions and labour force status
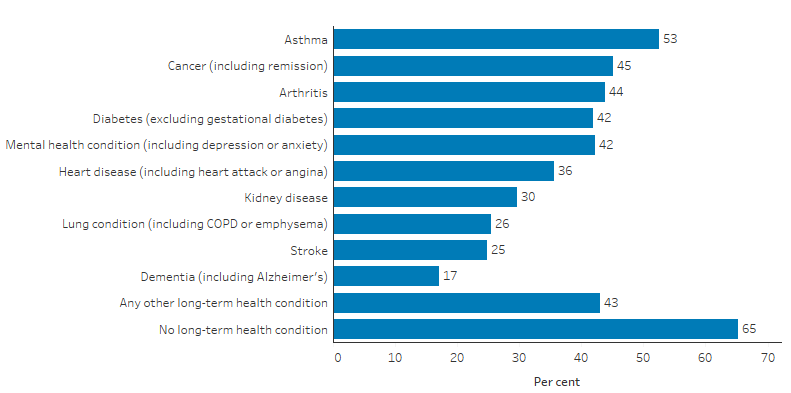
In the 2021 Census, people were asked whether they had been told by a doctor or nurse that they had any of a selected list of 10 long-term health conditions, as well as the option of choosing ‘any other long-term health condition’. Indigenous Australians aged 25–64 who reported having a long-term health condition had a lower employment rate than those with no long-term conditions (ranging from 17% to 53% for those with a long-term health condition, compared with 65% for those without) (Table 2.07.20, Figure 2.07.6).
Figure 2.07.6. Employment rate for Indigenous Australians aged 25–64, by selected long-term health conditions, 2021
Source: Table 2.07.20. AIHW analysis of ABS Census of Population and Housing (ABS 2022a).
Disability, unpaid carers and labour force status
Based on the 2021 Census, 26,800 of Indigenous Australians aged 25–64 required assistance with core activities, while 296,600 did not (excludes people for whom Indigenous status and/or need for assistance were unknown). The employment rate among Indigenous Australians aged 25–64 who needed assistance with core activities was 14%, compared with 62% among those who did not need assistance (Table D2.07.21).
In 2021, Indigenous Australians aged 15 and over who provided unpaid assistance to a person with disability, illness or due to old age were less likely to be in the labour force than other Indigenous Australians (56% compared with 58%) (Table D1.14.26).
Educational attainment and employment
Education attainment is associated with employment outcomes, with people who have completed tertiary level education generally having better employment opportunities than those who have not completed further education after leaving school (National Skills Commission 2021).
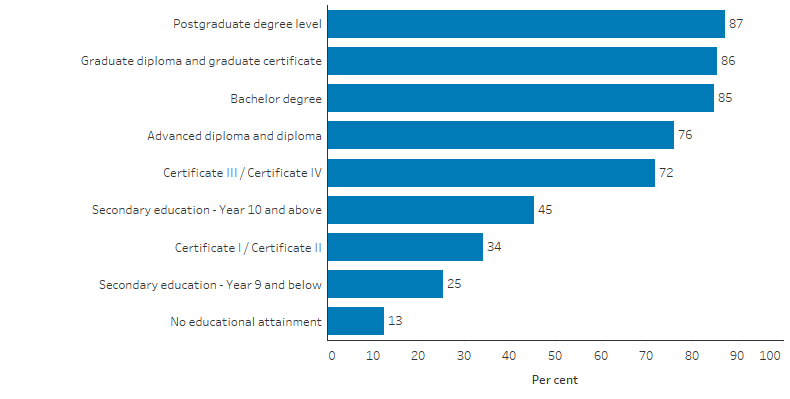
In 2021, the proportion of Indigenous Australians aged 25–64 who were employed increased with each level of educational attainment. For example, among Indigenous Australians aged 25–64, 85% of those whose highest level of education was a Bachelor Degree were employed, compared with 72% of those with a Certificate III or IV level qualification, 45% of those with a secondary education at Year 10 to 12 level, and 24% of those with lower levels of qualification (Year 9 or below, or no educational attainment) (Table D2.07.20, Figure 2.07.7).
Figure 2.07.7: Employment rate for Indigenous Australians aged 25–64, by highest level of educational attainment, 2021
Source: Table D2.07.19. AIHW analysis of ABS Census of Population and Housing (ABS 2022d).
A similar pattern was observed across remoteness area of usual residence, with generally higher employment rates at higher levels of educational attainment (Table 2.07.22). Among Indigenous Australians aged 25–64, the employment rate across the 5 remoteness areas (Major cities to Very remote) was:
- 82% or more for those whose highest attainment was a Bachelor Degree or higher,
- between 76% and 80% for those with Diploma or Advanced Diploma as their highest attainment,
- between 64% and 75% for those with a Certificate III or IV as their highest attainment,
- between 30% and 52% for those with a secondary education level at Year 10 to 12 as their highest attainment,
- 30% to 34% for those with a Certificate I or II as their highest attainment in Major cities, Inner regional and Outer regional areas, though the employment rate was higher for those with this level of attainment in Remote and Very remote areas at 46% and 48% respectively, and
- 17% to 29% for those with a highest attainment of Year 9 or below, and 8% to 16% for those with no educational attainment (Table 2.07.22).
The National Agreement on Closing the Gap specifies a target to increase the proportion of Indigenous Australians aged 15–24 engaged in employment, education or training to 67% by 2031.
According to the 2021 Census, the proportion of Indigenous Australians aged 15–24 who were fully engaged in employment, education or training was 58% (80,500 of 138,800 people) (Productivity Commission 2023). This was an increase from 57% in 2016 (the baseline year).
Employment by occupation
Data from the 2021 Census of Population and Housing showed that, among employed Indigenous Australians aged 25–64, around 32,100 (18%) were community and personal service workers, and a further 31,000 (17%) were professionals. About 24,100 (13%) were clerical and administrative workers, 24,000 (13%) were technicians and trade workers, and another 24,000 (13%) were labourers (AIHW analysis of ABS 2022a, excludes people for whom occupation weas not stated or inadequately described).
In 2021, the main industries in which employed Indigenous Australians aged 25–64 and over worked were health care and social assistance (about 33,000; 19%), public administration and safety (22,300; 13%), education and training (19,000; 11%), and construction (18,200; 10%) (percentages exclude not stated/inadequately described responses) (AIHW analysis of ABS 2022c).
Among Indigenous Australians aged 25–64 working in the health care and social assistance industry, 78% were female (about 25,800). Among Indigenous Australians aged 25–64 employed in construction, 88% (about 16,000) were male (AIHW analysis of ABS 2022a).
Main difficulties in finding work
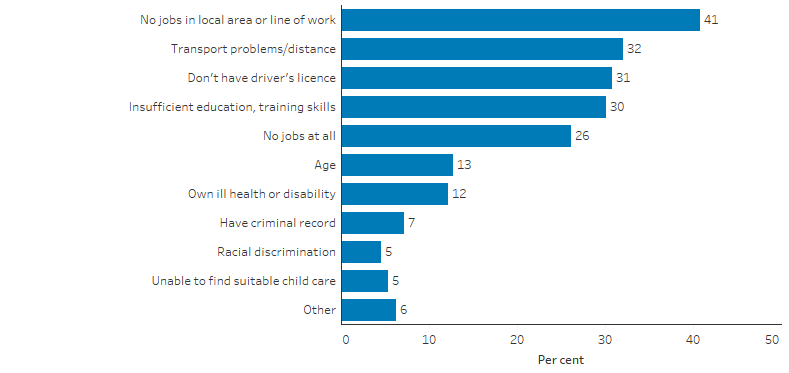
Data from the 2014–15 NATSISS showed that, of Indigenous Australians aged 15–64 who were unemployed, 92% (48,735) reported having difficulties finding work. The main difficulties in finding work were that there were no jobs in the local area or a particular line of work (41%; 21,640), issues with transport (32%; 17,020), not having a driver’s licence (31%; 16,350) and having insufficient education or training skills (30%; 15,960) (Table D2.07.10, Figure 2.07.8).
Figure 2.07.8: Main difficulties finding work, by type of difficulty, unemployed Indigenous Australians aged 15–64, 2014–15
Source: Table D2.07.10. AIHW and ABS analysis of National Aboriginal and Torres Strait Islander Social Survey 2014–15.
Comparisons with non-Indigenous Australians
Based on data from the 2021 ABS Census of Population and Housing, Indigenous Australians aged 15–64 had a lower labour force participation rate than non-Indigenous Australians (60%, compared with 79%) and a lower employment rate (52%, compared with 75%) (Table D2.07.3, Figure 2.07.9).
The gap in employment between Indigenous and non-Indigenous Australians was substantially lower in the public sector than in the private sector. In 2021, based on Census data, just over 10% of Indigenous people aged 15–64 were employed in the public sector – 2.4% by the Australian Government, 6.6% by state and territory governments, and 1.5% by local governments. A further 41% of Indigenous Australians were employed in the private sector (AIHW analysis of ABS 2022a).
The difference between Indigenous and non-Indigenous Australians in the employment rate in the private sector was 21 percentage points in 2021 (41% for Indigenous Australians, compared with 62% for non-Indigenous), compared with under 1 percentage point in the Australian Government (2.4% compared with 2.9%), and under 2 percentage points for state and territory governments (6.6% compared with 8.0%). A higher proportion of Indigenous than non-Indigenous Australians were employed in local governments (1.5% compared with 1.0% respectively) (AIHW analysis of ABS 2022a).
In 2021, 7.4% of Indigenous Australians aged 15–64 were unemployed (around 36,000 of 485,500 people for whom labour force status was stated), compared with 3.9% of non-Indigenous Australians (589,400 of 14,971,200). Expressed as a proportion of the labour force, the unemployment rate among Indigenous Australians aged 15–64 was 12% (around 36,000 of 289,700 people), compared with 5.0% (589,400 of 11,762,700) for non-Indigenous Australians (Table D2.07.3).
Figure 2.07.9: Employment rate, people aged 15–64, by Indigenous status and age group, 2021
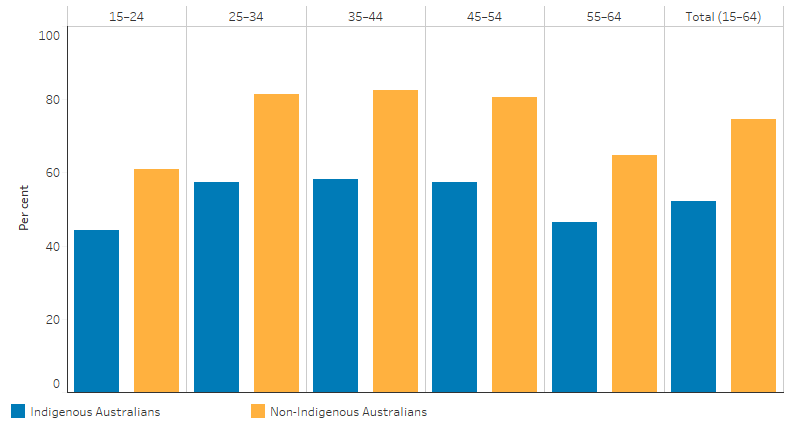
Source: Table 2.07.3. AIHW analysis of ABS Census of Population and Housing (ABS 2022a).
The Closing the Gap target for employment relates to those aged 25–64 (rather than 15–64): excluding younger people (15–24) who are often still engaged in formal study. Among Indigenous Australians aged 25–64 in 2021, 56% were employed, compared with 78% of non-Indigenous Australians (Table D2.07.3). Looking at Census data over the decade to 2021:
- between 2011 and 2016 the employment rate for both Indigenous and non-Indigenous Australians aged 25–64 changed little, and
- between 2016 and 2021, the employment rate for Indigenous Australians aged 25–64 increased by 4.7 percentage points (51.0% to 55.7%), compared with a smaller increase of 2.0 percentage points for non-Indigenous Australians (75.7% to 77.7%), resulting in a small narrowing of the gap (from rate difference of 24.7 to 22.0 percentage points) (Table 2.07.18).
Looking at occupation among people aged 25–64, a higher proportion of employed Indigenous Australians were community and personal service workers (17% of employed Indigenous Australians) than non-Indigenous Australians (10% of employed non-Indigenous Australians), while a lower proportion were employed as professionals (17% compared with 27%) (ABS 2022a).
In 2021, 6.2% of Indigenous Australians aged 25–64 were unemployed, compared with 3.2% of non-Indigenous Australians. When expressed as a proportion of the labour force, the unemployment rate for Indigenous Australians aged 25–64 was 2.5 times the rate for non‑Indigenous Australians (10% compared with 4.0%, respectively) (Table D2.07.3). For Indigenous Australians, the unemployment rate decreased between 2016 and 2021, from 15.0% to 10.0%, while for non-Indigenous Australians it decreased from 5.3% to 4.0%. The gap in unemployment rates was lower in 2021 (6.0 percentage points) than in 2016 (9.7 percentage points) (Table D2.07.18).
Research and evaluation findings
Employment is an important determinant of health outcomes. Health benefits from being employed include providing an adequate and reliable income (see measure 2.08 Income) allowing a person to support themselves, their family and their community AIHW 2019, and giving the person a sense of purpose (Marmot et al. 2008). People with higher incomes may have better health outcomes because they have better access to health services, while people with poorer health may have lower incomes due to work limitations caused by their health conditions (AIHW 2015). Employment can have adverse health effects; for example, working longer hours or the insecurity of working too few hours may lead to a deterioration of health (Laplagne et al. 2007). Job quality, employment conditions, the nature of work and job security are therefore essential factors of employment and its effect on health (Arthur 1999; Marmot et al. 2008; Wilkinson Richard G & Marmot 2003).
Being unemployed can unfavourably affect a person’s health. Health risks from being unemployed include the effect on a person’s mental health and stress-related health effects such as heart disease (Pickett & Wilkinson 2015; Wilkinson R.G. & Pickett 2009); material deprivation for necessities such as food security, safe neighbourhoods and adequate housing (Bambra 2011); and the effects from adopting unhealthy coping behaviours (Dooley et al. 1996).
Experiencing extended or repeated periods of unemployment compound these effects. For example, it has been found that the population experiences poorer health and lower life expectancy following an economic downturn (Taulbut et al. 2013).
The extent to which employment affects health is, however, less understood and needs more research (Ahonen et al. 2018).
In addition to poor health outcomes, lower levels of education and training, higher levels of contact with the criminal justice system, experiences of discrimination and lower levels of job retention may contribute to lower employment rates for Indigenous Australians (Gray et al. 2012).
Indigenous Australians face greater barriers to employment. While some industries have pioneered excellent initiatives to enable greater levels of Indigenous employment, there continue to be barriers for many Indigenous Australians, including a lack of access to high-quality and relevant training, limited access to supportive workplaces, inconsistent mentoring for young Indigenous job seekers and few long-term job opportunities (House of Representatives Standing Committee on Indigenous Affairs 2021). For those living in remote areas, poor access to transport also limits job opportunities. In addition to these workplace and logistical obstacles, more frequent interactions with the justice system can create additional barriers with factors like having a police record limiting employability.
It has also been suggested that the historical exclusion of Indigenous Australians and institutional racism affecting participation in education, training and the national economy is associated with a range of adverse health conditions, including internal stress and subsequent mental health and chronic physical health problems, and attempted suicide (Nguyen & Cairney 2013).
While employment is generally regarded as a major determinant of health and wellbeing, in the Indigenous Australian context, the effect of employment on health may be less important. Conventional economic indicators are developed around the assumption that wealth accumulation and economic participation in the labour force are primary determinants of positive wellbeing. However, these models fail to recognise Aboriginal and Torres Strait Islander concepts of wellbeing that are more holistic and include the cultural, spiritual and ecological as well as the physical, social and emotional. They also fail to recognise alternative measures of economic success (and associated wellbeing) that may be more relevant for Indigenous Australians (Prout 2012).
In Remote areas, for example, fewer young Indigenous Australians are fully engaged in work or study compared with young non-Indigenous Australians (see Table D2.07.9). Despite this, self-assessed health status is better overall in remote communities—which may reflect higher involvement in cultural activities (Altman Jon & Gray 2005; Carson et al. 2007).
The Australian Government implements a range of policies and programs to increase Indigenous employment levels, including:
- policies and programs that promote employment opportunities and career pathways for Indigenous Australians
- employment service programs that seek to support individuals to transition into work and develop long-term careers.
Evaluations of these policies and programs are described below against the two key themes.
Employment opportunities for Indigenous Australians
The Commonwealth Indigenous Procurement Policy (IPP) was established in 2015 to stimulate Indigenous entrepreneurship, business and economic development, providing Indigenous Australians with more opportunities to participate in the economy through Australian Government procurement.
Research suggests that Indigenous businesses are much more likely to employ an Indigenous person than a non-Indigenous business (Hunter Boyd 2015), and provide skills development and training (Morrison et al. 2017). Further, case study evidence suggests that Indigenous businesses can create a climate of fostering young Indigenous people into long-term career pathways, in environments where there is self-determination and capacity to build and develop community-based values (Fordham et al. 2017).
Specifically, the IPP significantly increases the rate of Commonwealth government purchasing from Indigenous businesses and provides opportunities for Indigenous people to participate in the delivery of high value Government contracts, either through supply chain and/or employment. The targets are intended to broadly reflect Indigenous population levels and ensure Indigenous people and businesses are proportionately represented in Commonwealth procurement. The rationale is that stimulating economic and business development builds Indigenous wealth and provides opportunities for greater economic independence and empowerment.
The IPP has substantially increased Commonwealth Government contracting with Indigenous businesses. In the IPP’s first year, 2015-16, Indigenous businesses won around $350 million in contracts, compared to over $1.6 billion in 2021-22. Since 2015, the IPP has generated over $6.9 billion in contracting opportunities. This has involved over 47,500 contracts awarded to more than 3,000 Indigenous businesses (NIAA 2023).
Since the introduction of the IPP in 2015, the Indigenous business sector has grown rapidly (PM&C 2018c, 2019). On Census night in 2021, around 17,900 Indigenous Australians identified themselves to be business owners; an increase of approximately 6,320 new business owners compared with the 2016 Census (NIAA analysis of ABS 2022b).
Several research projects are underway to analyse the impacts of Indigenous preferential procurement policies across Australia and build a national Indigenous business and economic dataset to produce longitudinal Indigenous business statistics. These projects aim to inform the sector and its stakeholders, including policy and decision makers and Indigenous business owners.
Employment programs to support Indigenous Australians to find work
Employment programs are designed to provide support services to enable Indigenous Australians to find work. These employment services include providing training, skill development and workplace opportunities. In non-remote areas, Indigenous job seekers are supported by mainstream and Indigenous specialist Workforce Australia providers, as well as Disability Employment Service providers. In remote Australia, Indigenous job seekers are assisted through CDP providers.
Consultations, evaluations and reviews of employment programs and services have highlighted the need to give communities more control to determine local projects and increase economic opportunities and jobs, as well as the benefit of tailoring services to an individual’s needs and aspirations.
The 2018 evaluation of the CDP highlighted the diverse strengths, barriers and support needs of job seekers in remote areas, (PM&C 2018a, 2018b; Winangali & Ipsos 2018). Community members noted the importance of providing a range of quality activities to engage job seekers with different interests and capabilities. Good quality employment activities were described as community-led or endorsed and making a meaningful improvement to the community; culturally appropriate and providing opportunities for social engagement and inclusion; and providing a clear pathway to a real job or tangible skills development.
The NIAA has commissioned several major evaluations of Indigenous-specific employment programs in recent years. These include Indigenous Employment Programs (Deloitte & NIAA 2021), Indigenous Cadetships (NIAA 2020a) and TAEG-School Based Traineeship Program (NIAA 2020b). Outcomes of these evaluations include the following:
- Indigenous Australians should be involved in the design of employment programs and measuring and benchmarking success and effectiveness.
- Employers need to be supported to build internal capabilities to ensure culturally safe and appropriate employment opportunities for Indigenous Australians.
- Governance structures need to ensure culturally safe communication between key agencies, service providers and Indigenous Australians.
- Consistent sharing of lessons learned should take place to improve effectiveness and efficiency of programs.
- Synergies and linkages between various employment programs should be identified, and there should be flexibility in how activities are to be delivered, based on demand.
Implications
The 2020 National Agreement on Closing the Gap outlined new targets for employment. A key focus in 2021-22 was providing continued support to Indigenous Australian job seekers while also undertaking transformational reforms to mainstream employment services including Workforce Australia from 4 July 2022. Assistance provided through mainstream services was supported by complementary programs that supported Indigenous parents to prepare for work and place-based projects through the Local Jobs Program. In 2022, the Australian Government reformed its mainstream and targeted employment program to ensure remote and non-remote jobseekers are supported in finding and maintaining employment. Workforce Australia, delivered by the Department of Employment and Workplace Relations (DEWR), replaced Job Active from 4 July 2022. The new employment services program includes a new online service and a network of providers to deliver personalised support. The aim is to help Australians find and keep a job, change jobs or create their own job (Australian Government 2022).
The Australian Government’s focus for Outcome 7 of the National Agreement is on establishing and strengthening partnerships with Indigenous Australians to share in decision-making on strategies that will boost the participation of Indigenous youth in education, training and employment. Achieving Outcome 7 contributes to the achievement of Outcome 8.
Achieving Outcome 8 of the National Agreement will be heavily influenced by broader economic conditions. While the Australian labour market has performed well, future economic conditions are likely to be challenging. These challenging economic conditions reinforce the importance of mainstream employment services actively supporting Indigenous job seekers to remain engaged in the labour market and build the skills and experience to fill new and emerging jobs.
Employment services alone cannot close the gap. Ongoing employment growth combined with improving educational attainment among Indigenous Australians is needed. The 2023 Closing the Gap Implementation Plan outlined that improved Vocational Education and Training and higher education outcomes for Indigenous Australians will improve participation of Indigenous Australians in the labour market.
Approaches with the potential to increase employment for Indigenous Australians include increasing skill levels; pre-employment assessment and training; intensive assistance for job seekers; non-standard recruitment strategies; support for retention; wage subsidies and Indigenous employment goals in government programs; and policies that support Indigenous skills required for available jobs (Gray & Hunter 2016; Gray et al. 2012). Structural changes across housing, industry, transport and roads, education and health services can also help with the employment of Indigenous Australians.
While increasing employment helps to address economic disadvantage, conventional measures of employment ignore the positive wellbeing aspects of cultural engagement. The Gari Yala Report (Evans 2021) indicates Indigenous Australians face workplace challenges that their non-Indigenous colleagues do not. This survey of 1,033 Aboriginal and Torres Strait Islander workers indicated that 38 per cent reported being treated unfairly because of their Indigenous background sometimes, often or all the time (Evans 2021). Cultural competency training for staff that addresses racism and discrimination in the workplace, and the cultural load that Indigenous Australians are often subjected to, can improve the retention rate and career development of Indigenous employees (Minderoo Foundation et al. 2022 ).
As recommended by Reconciliation Australia, workplaces looking to improve their retention of Indigenous employees should accommodate cultural requirements that may interfere with employment, such as leave for Sorry Business or flexible work arrangements that allow for working on Country, as this supports Indigenous employees to feel culturally safe .Therefore it is crucial for reporting frameworks to recognise, alongside conventional measures, that different cultures may have different constructs and experiences of employment and work (Carson et al. 2007; Dockery 2010).
In 2020 the Commonwealth Aboriginal and Torres Strait Islander Workforce Strategy 2020-2024 (Strategy) was released with three areas of focus: cultural integrity, career pathways and career development and advancement.
The Strategy contains targets for the Commonwealth, not just the Australian Public Sector (APS). The targets are:
- 5% representation at APS 4 to APS 6 levels by 2022 and Executive Level 1 and Executive Level 2 levels by 2024, and
- 3% representation at the Senior Executive Service levels by 2024
Data as at December 2022 (APSED) indicates that Indigenous representation in the APS has not changed significantly in two decades, remaining at 3.6% and, as a result, these targets are unlikely to be achieved without a change in approach.
Since the launch of the Strategy the Australian Government announced a target for Indigenous Australians in the public service of 5% by 2030 and an action plan will be developed to position the Strategy within that revised policy context.
The Boosting First Nations Employment in the APS to 5% by 2030 initiative represents an accelerated and concentrated effort through the establishment of a First Nations Unit in the Australian Public Service Commission, which will focus on whole of service senior representation, retention and cultural capability. This approach will be monitored to assess effectiveness and refined over time.
The United Nations Permanent Forum on Indigenous Issues recommends that Indigenous wellbeing reporting frameworks include some recognition of the value of Indigenous work such as ‘making a living’ rather than simply ‘having a job’. It advocates including indicators that provide insight into Indigenous participation, and economic benefit from, customary or subsistence activities in addition to, instead of, or in comparison with, mainstream economic engagement. These might include ‘working on Country’ programs—which support Indigenous Australians to combine traditional knowledge with conservation training to protect and manage their land, sea and culture (Prout 2012). Young recommends that work be redefined to be inclusive of these practices that First Nations people undertake as part of their cultural responsibilities to community and Country (Young 2022).
These learnings provided valuable insight into the design of a new initiative, the Indigenous Skills and Employment Program (ISEP), which aims to connect Indigenous Australians to jobs, career advancement opportunities, and to new training and job-ready activities through flexible local projects that have been designed with community. They are also informing the process to replace the Community Development Program (CDP) with a new program with real jobs, proper wages and decent conditions—developed in partnership with Indigenous Australians.
Gaining a better sense of what ‘being employed’ or ‘being workful’ means to people, such as being employed in the mainstream labour market or engagement in tasks that contribute to the community or cultural development, affords the opportunity to explore which method produces greater health benefits (Urquhart 2009).
The Policy Context is at Policies and Strategies.
References
- ABS (Australian Bureau of Statistics) 2017. Census of Population and Housing: Reflecting Australia—stories from the Census, 2016. ABS cat. no. 2071.0. . Canberra: ABS.
- ABS 2022a. 2021 Census - counting persons, place of usual residence [Census TableBuilder].
- ABS 2022b. Census of Population and Housing [TableBuilder]. Viewed 19 April 2023.
- ABS 2022c. Comparing the 2021 Census and the Labour Force Survey.
- ABS 2022d. Employment in the 2021 Census.
- Ahonen EQ, Fujishiro K, Cunningham T & Flynn M 2018. Work as an Inclusive Part of Population Health Inequities Research and Prevention. American Journal of Public Health 108:306-11.
- AIHW (Australian Institute of Health and Welfare) 2015. The health and welfare of Australia’s Aboriginal and Torres Strait Islander peoples 2015. Canberra: AIHW.
- AIHW 2019. Income support among working-age Indigenous Australians. Canberra.
- Altman J & Gray M 2005. The economic and social impacts of the CDEP scheme in remote Australia. Australian Journal of Social Issues 40:399-410.
- Altman JC, Buchanan G & Biddle N 2005. The real 'real' economy in remote Australia. In: Hunter BH (ed.). Assessing The Evidence on Indigenous Socioeconomic Outcomes: A Focus on the 2002 NATSISS. Canberra: ANU E Press, 139-52.
- Arthur W 1999. Careers, aspirations and the meaning of work in remote Australia. Canberra: Centre for Aboriginal Economic Policy Research, Australian National University.
- Australian Government 2022. Workforce Australia.
- Bambra C 2011. Work, worklessness, and the political economy of health. Oxford University Press.
- Belachew TA & Kumar A 2014. Examining Association Between Self-Assessed Health Status and Labour Force Participation Using Pooled NHS Data. Canberra: ABS.
- Carson B, Dunbar T, Chenhall RD & Bailie R 2007. Social determinants of Indigenous health. Allen & Unwin.
- Deloitte & NIAA 2021. Indigenous Employment Program Evaluation – Final Report.
- Dooley D, Fielding J & Levi L 1996. Health and unemployment. Annual Review of Public Health 17:449-65.
- Dudgeon P, Milroy J, Calma T, Luxford Y, Ring IT, Walker R et al. 2016. Solutions That Work: What the evidence and our people tell us. Perth: ATSISPEP.
- Evans O 2021. Gari Yala (Speak the Truth): gendered insights. Sydney, Australia.
- Fordham AE, Robinson GM & Blackwell BD 2017. Corporate social responsibility in resource companies–Opportunities for developing positive benefits and lasting legacies. Resources Policy 52:366-76.
- Gray M & Hunter B 2016. Indigenous Employment after the Boom. Canberra: CAEPR.
- Gray M, Hunter B & Lohoar S 2012. Increasing Indigenous employment rates. (ed., Australian Institute of Health and Welfare & Australian Institute of Family Studies). Canberra: Closing the Gap Clearinghouse.
- House of Representatives Standing Committee on Indigenous Affairs 2021. Report on Indigenous Participation in Employment and Business.
- Hunter B, Dinku Y, Eva C, Markham F & Murray M 2022. Employment and Indigenous mental health. Produced for the Indigenous Mental Health and Suicide Prevention Clearinghouse.: AIHW, Australian Government.
- Hunter Boyd 2015. Indigenous employment and businesses: Whose business is it to employ Indigenous workers? : Canberra, ACT: Centre for Aboriginal Economic Policy Research (CAEPR).
- Kalb GR, Le T, Hunter BH & Leung F 2012. Decomposing differences in labour force status between Indigenous and non-Indigenous Australians.
- Laplagne P, Glover M & Shomos A 2007. Effects of health and education on labour force participation. Available at SSRN 1018889.
- Lowry D & Moskos M 2007. Labour force participation as a determinant of Indigenous health.
- Marmot M, Friel S, Bell R, Houweling TAJ, Taylor S & Commission Social Determinants H 2008. Closing the gap in a generation: health equity through action on the social determinants of health. The Lancet 372:1661-9.
- Minderoo Foundation, Bankwest Curtin Economics Centre (BCEC) at Curtin University & Murawin 2022. Woort Koorliny - Australian Indigenous Employment Index 2022 National Report.
- Morrison M, Collins J, Krivokapic-Skoko B & Basu PK 2017. Differences in the economic and social contributions of private and community-owned Australian Indigenous businesses. Journal of Australian Indigenous Issues 20:23-40.
- National Skills Commission 2021. Australian Jobs 2021.
- Nguyen OK & Cairney S 2013. Literature review of the interplay between education, employment, health and wellbeing for Aboriginal and Torres Strait Islander people in remote areas: working towards an Aboriginal and Torres Strait Islander wellbeing framework. Ninti One Limited.
- NIAA (National Indigenous Australians Agency) 2020a. Evaluation of the Indigenous Cadetship Support (ICS) and Tailored Assistance Employment Grants (TAEG) Cadets Programs.
- NIAA 2020b. Evaluation of the TAEG-School Based Traineeships Program – 2016-19
- NIAA 2023. Indigenous Procurement Policy.
- Pickett KE & Wilkinson RG 2015. Income inequality and health: A causal review. Social Science & Medicine 128:316-26.
- PM&C (Department of the Prime Minister and Cabinet) 2018a. The Community Development Programme: Evaluation of Participation and Employment Outcomes. (ed., Cabinet DotPM). Canberra.
- PM&C 2018b. An evaluation of the first two years of the Community Development Programme - Summary. Canberra: Department of the Prime Minister & Cabinet.
- PM&C 2018c. The Indigenous Business Sector Strategy.
- PM&C 2019. Third Year Evaluation of the Indigenous Procurement Policy.
- Productivity Commission 2023. Closing the Gap Information Repository. Viewed 23 June 2023.
- Prout S 2012. Indigenous wellbeing frameworks in Australia and the quest for quantification. Social Indicators Research 109:317-36.
- Taulbut M, Walsh D, Parcell S, Hartmann A, Poirier G, Strniskova D et al. 2013. What can ecological data tell us about reasons for divergence in health status between West Central Scotland and other regions of post-industrial Europe? Public Health 127:153-63.
- Urquhart B 2009. Summary of selected social indicators. Australian Indigenous HealthInfoNet.
- Wilkinson RG & Marmot M 2003. Social determinants of health: the solid facts. World Health Organization.
- Wilkinson RG & Pickett KE 2009. Income Inequality and Social Dysfunction. Annual Review of Sociology 35:493-511.
- Winangali & Ipsos 2018. The many pathways of the Community Development Programme. Department of Prime Minister and Cabinet.
- Young N 2022. First Nations workers are everywhere. The jobs summit must tackle Indigenous-led employment policy too.

