
Self-discharge from hospital
The number of people who leave hospital before discharge by their clinician can be interpreted as an indirect measure of patient dissatisfaction and reflects the extent to which health services are responsive to patients’ needs.
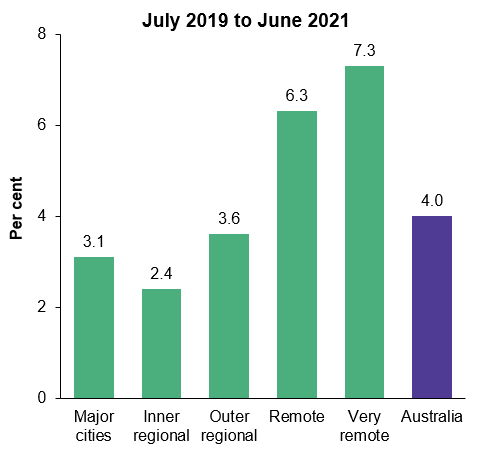
Nationally, 26,985 hospitalisations for First Nations people over the period from July 2019 to June 2021 ended in discharge at own risk, equating to 4% of all First Nations hospitalisations (excluding dialysis). In general, the proportion of hospitalisations that ended in discharge at own risk for First Nations people increased with remoteness of usual residence (ranging from 3.1% of all hospitalisations for people living in Major cities to 7.3% in Very remote areas), the exception being for those living in Inner regional areas who were the least likely to leave at their own risk (2.4%) (Figure 6.8).
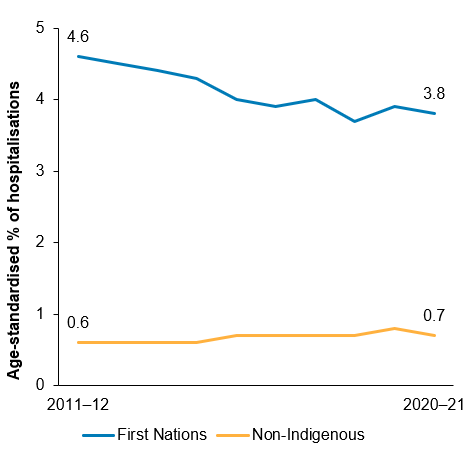
Over the decade 2011–12 to 2020–21, the age-standardised proportion of hospitalisations for First Nations people that ended in discharge at own risk decreased from 4.6% to 3.8%, while the proportion for non-Indigenous Australians remained similar (from 0.6% to 0.7%). The absolute difference in age-standardised proportions between First Nations people and non-Indigenous Australians decreased from 3.9 percentage points to 3.0 percentage points, narrowing the gap (Figure 6.8).
Figure 6.8: Proportion of hospitalisations (excluding dialysis) ending in discharge at own risk, for First Nations people by remoteness (crude proportion, July 2019 to June 2021), and by Indigenous status (age-standardised, 2011–12 to 2020–21)
Source: Measure 3.09, Table D3.09.4 and Table D3.09.6 – AIHW analysis of National Hospital Morbidity Database.
In the context of emergency department presentations, the terms ‘did not wait’ and ‘left at own risk’ are used. ‘Did not wait’ refers to presentations where patients did not wait to be attended by a health care professional. ‘Left at own risk’ refers to presentations where patients left at own risk after being attended by a health care professional but before the non-admitted patient emergency department service episode was completed.
There were 119,278 public hospital emergency department presentations for First Nations people where the patient did not wait or left at own risk, representing about 1 in 11 (9.4%) public hospital emergency department presentations in this period. Of these 119,278 emergency department presentations:
- in 75,185 (63.0%) presentations the patients did not wait, representing 5.9% of all emergency department presentations for First Nations people
- in 44,093 (37.0%) presentations, the patients left at own risk without completing treatment, representing 3.5% of all emergency department presentations for First Nations people.
Over the decade from 2011–12 to 2020–21, the age-standardised proportion of public hospital emergency department presentations where First Nations people left at own risk increased from 2.1% to 3.4%. There was also an increase for non-Indigenous Australians, from 1.6% to 2.4% over the same period.
In contrast, between 2011–12 and 2020–21, the proportion of public hospital emergency department presentations where First Nations people did not wait to be seen by a health professional decreased from 7.0% to 5.8%, and the proportion for non-Indigenous Australians decreased from 4.8% to 3.8%.
For further information, see: