
The Aboriginal and Torres Strait Islander Health Performance Framework (HPF) uses the following statistical terms and methods for analysis.
First Nations people and non-Indigenous population descriptors
The term ‘First Nations people’ is now the preferred term used by the AIHW when referring to Aboriginal and Torres Strait Islander people. Across the HPF website, ‘Indigenous Australians’ is also used. As content on the HPF website is updated, this will be progressively changed to ‘First Nations people’.
In most of the data presented, ‘First Nations people’ refers to people who have identified themselves, or been identified by a representative (for example, a parent or guardian), as being of Aboriginal and/or Torres Strait Islander origin. For a few data collections, such as those associated with government grants and payments, information on acceptance of a person as being of Aboriginal and Torres Strait Islander origin by their community may also be required See also Glossary.
Note that references to ‘First Nations people’ on this website refer to First Nations people in Australia only. Where data are compared with those for indigenous people internationally, for clarity, ‘Aboriginal and Torres Strait Islander people’ will be used.
The ‘non Indigenous Australians’ descriptor is used where the data collection allows for the separate identification of people who do not identify as First Nations. The label ‘other Australians’ is used to refer to the combined data for non-Indigenous people, and those for whom Indigenous status was not stated.
Crude rates
A crude rate is the number of events over a specified period (for example, a year) divided by the total population at risk during that period.
Age-specific rates
An age-specific rate is defined as the number of events for a specified age group over a specified period (for example, a year) divided by the population of that age group. Age-specific rates are useful for comparing rates across age groups when rates are strongly age-dependent.
Age-standardisation
Age-standardisation is a method used to reduce the influence of differences in age structure and therefore allow comparisons of summary rates between two populations that have different age structures. Age-standardisation is used throughout this report when comparing First Nations people with non-Indigenous Australians, for a range of variables where age is a factor and when monitoring trends over time.
There are two different methods of age-standardisation, direct and indirect. The method most commonly used for the HPF is direct age-standardisation, however, some tables presenting data from the National Hospital Morbidity Data Collection use the indirect method.
Direct age-standardisation
Age-standardised rates, based on the direct age-standardisation method, are defined as the weighted average of age-specific rates, with the weights being equal to the proportion of people in each age group of the standard population. In HPF, the 2001 Australian standard population is used for direct age-standardisation. In general, 5-year age groups up to 75+ are used (0–4, 5–9, …, 70–74 and 75+). However, depending on the availability and/or size of the data, this may vary – the 5-year age group may be combined into larger age groups, for example, 10-year age groups, up to 65+ or 55+. In some specific topics, such as smoking during pregnancy, age-standardisation is applied by 5-year age groups for women aged 15 to 44.
Rate difference and rate ratio
A rate difference is the absolute difference between two rates, and is calculated by subtracting one rate from another. For example, the rate for First Nations people with a particular characteristic minus the rate for non-Indigenous Australians with the same characteristic shows the absolute difference between the two.
A rate ratio measures the relative difference between two population groups and is calculated by dividing one rate (for example, a rate for First Nations people with a particular characteristic) by another (for example, a rate for non Indigenous Australians with the same characteristic) to show the relative difference between the two. A rate ratio greater than 1 indicates a higher rate of the characteristics in the population of interest, and a ratio of less than 1 suggests a lower rate of the characteristic in the population of interest.
Relative standard error (RSE)
Sample surveys, particularly those conducted by the Australian Bureau of Statistics (ABS), are a major source of data for many statistics used in the HPF. The aim of sampling is to achieve ‘representation’ so that the results are the same as if the whole population had been included. When estimates are based on data from a sample that is selected from a population, rather than a full enumeration of that population, they are subject to sampling variability. This means the estimates may differ from what would have been produced if the data had been obtained from the complete population.
Standard error (SE) of the rate quantifies how much the sample estimate is expected to vary from its true value. In the HPF, the SE of a crude rate is generally calculated using the formula:
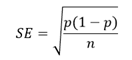
where p=m/n, m is the number of incidences and n is the size of the population. When p is very small (for example, rare events like deaths), the term (1 – p) is close to 1 and can be omitted from the above formula.
Relative standard error (RSE) measures reliability of estimates based on sampling error and expresses the standard error as a percentage of the estimate:
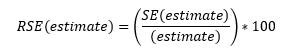
RSE is used for reliability thresholds. In the HPF, only estimates (numbers) with a RSE less than 25% are considered reliable. Estimates with RSE between 25% and 50% should be used with caution. Estimates with a RSE greater than 50% are considered too unreliable for general use due to high sampling error.
Margin of error (MOE)
The margin of error (MOE) is a measure of precision of an estimate and represents the range within which the true population value is likely to lie, given a specified level of confidence. MOE is directly related to the standard error (SE) of an estimate and is commonly reported for a 95% confidence level.
In the HPF, the MOE of an estimate is approximated as:
![]() Where SE is the standard error of the estimate and 1.96 is the z-score corresponding to a 95% confidence level.
Where SE is the standard error of the estimate and 1.96 is the z-score corresponding to a 95% confidence level.
A smaller MOE indicates greater precision, while a larger MOE indicates greater uncertainty in the estimate. In the HPF, the reliability of proportion estimates is assessed using the MOE, with proportions that have a large MOE advised to be interpreted with caution. In NATSIHS data, for example, a percentage estimate is considered to have a large MOE where it is greater than 10 percentage points; or the upper confidence limit (estimate plus MOE) exceeds 100%; or the lower confidence limit (estimate minus MOE) is less than 0%. All proportions annotated with a ‘#’ for having a large MOE should be used with caution.
Confidence intervals
Even when the underlying population rate is constant, the observed rate from a sample may vary due to random variation. A confidence interval (CI) is a way to measure the precision of an estimate using standard error (SE). A 95% CI describes a span of numbers around the estimate which has a 95% chance of including the true value. A narrow CI indicates high precision or low random error. Conversely, a wide CI indicates lower precision and hence greater uncertainty in the estimate. The 95% confidence interval of an estimate p is calculated by
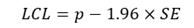
and
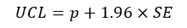
Where SE is the standard error, LCL and UCL stand for the lower and upper limit of the confidence interval, and 1.96 is the z-score corresponding to a 95% confidence level.
Annual change and per cent change over time
The annual change and per cent change over entire period are computed using two methods.
For some HPF measures, for example, in measures 3.15 Access to prescription medicines and 3.21 Expenditure on Aboriginal and Torres Strait Islander health compared to need, change over time in expenditure is calculated using the first and last year of data.
For most other measures, average annual change is calculated by applying least-squares linear regression method to utilise information from all available years. A simple linear regression model is fitted to the time series, with the measure as the dependent variable and time as the independent variable (y = a + bt). The estimated slope of the regression line represents the average annual change over the period.
Per cent change over time is calculated using the fitted values from the regression model, by subtracting the predicted value at the beginning of the period from the predicted value at the end of the period, divided by the predicted value at the beginning of the period and multiplied by 100. In the HPF, these analyses are generally undertaken when there are at least 5 data points, with some exceptions where 4 data points are available.
Significance tests
Significance tests are undertaken to determine whether the difference between two estimates (such as difference between numbers, means or proportions between First Nations and non-Indigenous Australians, between remote and non-remote areas, or between two different years) is significantly different from 0 or not. In HPF, significance tests are conducted at the 5% level (p<0.05).
The word ‘significant’
Significance tests determine whether the difference observed between two or more estimates for different groups or over time is likely to reflect a true difference or whether it could have occurred due to random variation. Statistical test showing statistically significant difference indicates a real difference with high level of confidence. In general, differences and changes over time highlighted in the HPF are statistically significant unless otherwise stated. However, it is important to note, that ‘statistical significance’ does not mean practical significance, and should not be used outside its statistical context.
Where results are shown to be statistically significant, an * (asterisk) is placed alongside the statistics included in the data tables. However, not all relationships in the data tables have been tested for significance.
Statistical testing for rate differences and rate ratios
The testing hypotheses for rate difference (RD) are
![]()
and
![]()
where RD = p1 – p2. If RD is outside the interval of (–1.96×SE(RD),1.96×SE(RD)), H0 is rejected. In this case we say that p1 and p2 are significantly different at the p < 0.05 level. In other words, the rate difference RD is significantly different from 0 at the p < 0.05 level. Otherwise, if RD is located inside the interval of (-1.96×SE(RD),1.96×SE(RD)), then p1 and p2 are not significantly different at the p < 0.05 level.
The testing hypotheses for rate ratio (RR) are
![]()
and
![]()
where RR= p1 / p2. If ln(RR) is outside the interval of (-1.96 × SE (ln(RR)),1.96 × SE (ln(RR))), H0 is rejected. In this case we say that the rate ratio is significantly different from 1 at the p < 0.05 level. Otherwise, the rate ratio is not significantly different from 1 at the p < 0.05 level.
Tables include an *(asterisk) next to the rate ratio and rate difference to indicate that rates for the First Nations and non-Indigenous populations are statistically significantly different from each other at the p< 0.05 level. Where results of significance testing differ between rate ratios and rate differences, caution should be exercised in the interpretation of the tests.
Statistical testing for annual change
Where linear regression is used to calculate annual change, the parameters of the simple linear regression line (y = a + bt) are estimated using least squares, where y represents the number or rate of the characteristic under study, t the time (year), a the intercept and b the slope coefficient representing the annual change. To test whether the annual change is statistically significant, the testing hypotheses are
![]()
and
![]()
The coefficient b follows a t-distribution with n – 2 degrees of freedom, where n is the number of years for which data is available. To test the significance of b, we use t* to denote the critical value of t at level 0.05. If b is located outside of the interval (–t*×SE(b), t*×SE(b)), then H0 is rejected. In this case we say that the regression estimate is significant at the level p< 0.05, or the coefficient b (annual change) is significantly different from 0 at the p < 0.05 level. Otherwise, the annual change is not significantly different from 0 at the p < 0.05 level.
Suppression of small numbers
In the HPF, primary (initial) suppression is used to withhold small numbers for confidentiality and/or reliability reasons. Where suppressing a single cell is not sufficient because the suppressed value could still be derived from totals or other reported values, consequential suppression is applied where necessary to prevent the back calculation of suppressed values.
The suppression rules applied can vary by data collection, depending on the nature of the data and the requirements of the data provider. For example, hospital data collections may require suppression of small cell counts to protect patient and hospital confidentiality, while some Australian Bureau of Statistics (ABS) survey and Census data apply random adjustment or perturbation techniques to reduce disclosure risk while retaining overall data utility.
In addition, general AIHW reliability rules are applied across the HPF, regardless of data collection.
Where no collection specific requirements are specified by the data provider, the following suppression rules are applied to ensure that published estimates are sufficiently reliable for interpretation and reporting:
- If the incidence is between 1 and 4, the number and corresponding rates are suppressed.
- If the incidence is zero, the number (0) is reported. However, corresponding per cent, rates and any derived statistics (e.g., rate difference, rate ratios) are suppressed.
- If a cell is suppressed, the cell value is replaced with “n.p.” (not published).
- If, after initial suppression, a suppressed value can still be derived from totals or other reported values, additional cells are suppressed to prevent back calculation. In general, a rate associated with a suppressed count greater than 4 is not suppressed unless it allows the suppressed count to be derived.
- For direct age standardised rates, if the total incidence is less than 20, the rate is also replaced with “n.p.”.