Key messages
- The leading 5 causes of death for Aboriginal and Torres Strait Islander people in the 5-year period 2015–2019 were cancer and other neoplasms (23%), circulatory diseases (23%) and injury and poisoning (15%), respiratory disease (10%) and endocrine, metabolic and nutritional disorders (9%).
- Death rates from all the 5 leading causes of death were higher for Indigenous Australians in remote than in non-remote areas.
- Over the decade from 2010 to 2019, the death rates for Indigenous Australians due to circulatory diseases and kidney diseases decreased (by 18% and 36%, respectively), while death rates due to cancer and other neoplasms, and injury and poisoning, both worsened (by 12% and 14%, respectively).
- Circulatory diseases accounted for the largest gap in mortality rates between Indigenous and non-Indigenous Australians in 2015–2019 (78 more deaths per 100,000 population for Indigenous than non-Indigenous Australians), followed by cancer and other neoplasms (65 per 100,000), and endocrine, metabolic and nutritional disorders (63 per 100,000).
- Research shows that improved management of chronic diseases can prevent the development of life-threatening complications.
- Since the introduction of the better cardiac care project there has been improvements in the level of access to cardiac-related health services, increased proportion of Indigenous Australians who received Medicare-funded health assessments and reductions in the mortality rate due to cardiac conditions.
Why is it important?
Analysis of leading causes of death can provide insights into the overall health status of different populations, as well as a better understanding of the contributing factors, and indicate areas needing policy focus. Disparities in mortality within the Aboriginal and Torres Strait Islander population and between Indigenous Australians and non-Indigenous Australians for particular causes of death can provide insight into where policy attention is needed to close the gap.
As the health status of Indigenous Australians improves, the rate of premature deaths is expected to decrease over-time.
This measure provides a high-level exploration of leading causes of death which are explored in further detail in the subject specific measures within Tier 1 of the Health Performance Framework. The types of diseases causing the most deaths for both Indigenous and non-Indigenous Australians are somewhat similar, although occurring at different rates and different ages. However, there have been different patterns in the trends for specific causes over time.
In July 2020, the National Agreement on Closing the Gap (the National Agreement) identified the importance of making sure Aboriginal and Torres Strait Islander people enjoy long and healthy lives, and that they enjoy high levels of social and emotional wellbeing. To support these outcomes the National Agreement specifically outlines the following targets to direct policy attention and monitor progress:
- Target 1—Close the Gap in life expectancy within a generation, by 2031, (with leading causes of death as a supporting indicator)
- Target 14— Significant and sustained reduction in suicide of Aboriginal and Torres Strait Islander people towards zero.
For the latest data on the Closing the Gap targets, see the Closing the Gap Information Repository.
The new National Aboriginal and Torres Strait Islander Health Plan 2021-2031 (the Health Plan), provides a strong overarching policy framework for Aboriginal and Torres Strait Islander health and wellbeing and is the first national health document to address the health targets and priority reforms of the National Agreement.
Both the National Agreement and the Health Plan are discussed further in the Implications section of this measure.
Burden of disease
Burden of disease analysis combines the years of healthy life lost due to living with ill health (non-fatal burden) with the years of life lost due to dying prematurely (fatal burden). In 2018, Indigenous Australians lost 113,445 years of life due to dying prematurely, equivalent to 137 years of life lost per 1,000 people.
Four disease groups accounted for over two-thirds of fatal burden that Indigenous Australians experienced in 2018: injuries (23%), cancer (20%), cardiovascular (or circulatory) diseases (19%) and infant and congenital conditions (9%).
For Indigenous children aged under 1, infant and congenital conditions were responsible for the majority of fatal burden in 2018 (82%). For Indigenous Australians aged under 45 (excluding infants), injuries were the leading cause of fatal burden (47% of fatal burden among those aged 1–14, and 80% for those aged 15–24). Among Indigenous Australians aged 45 and over, chronic diseases became the main contributors to fatal burden (with cancer and cardiovascular (or circulatory) diseases contributing 30% and 25%, respectively) (AIHW 2022).
Data findings
Mortality data in this measure are from 5 jurisdictions for which the quality of Indigenous identification in the deaths data is considered to be adequate; namely, New South Wales, Queensland, Western Australia, South Australia and the Northern Territory. Data by remoteness are reported for all jurisdictions combined (see Data sources: National Mortality Database).
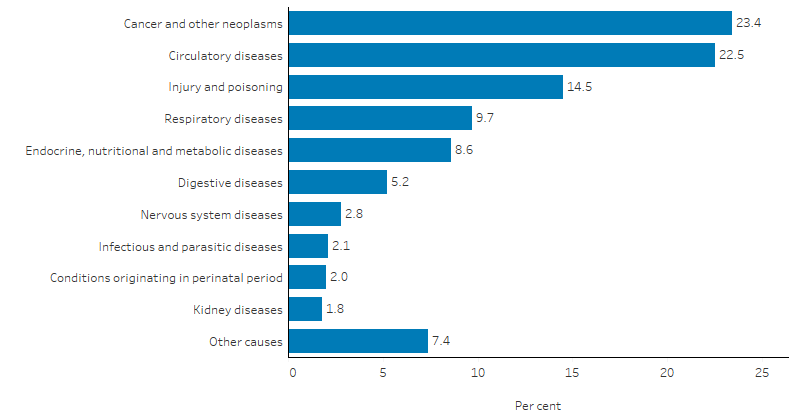
In the 5-year period 2015–2019, for Indigenous Australians the top 5 leading causes of death accounted for 80% (12,154 or 79%) of all deaths. These were:
- cancer and other neoplasms (3,612 or 23% of all deaths for Indigenous Australians)
- circulatory diseases (3,471 or 23%), for example, heart attack and stroke
- injury and poisoning (external causes) (2,240 or 15%), including suicide (intentional self-harm)
- respiratory diseases (1,498 deaths, or 10%)
- endocrine, metabolic and nutritional disorders which include mostly diabetes (1,333 or 9%) (Table D1.23.1, Figure 1.23.1).
Figure 1.23.1: Causes of mortality among Indigenous Australians, NSW, Qld, WA, SA and NT, 2015–2019
Note: ‘Other causes’ includes: diseases of blood and blood-forming organs; mental and behavioural disorders; diseases of the eye and adnexa; diseases of the ear and mastoid process; diseases of the skin and subcutaneous tissue; diseases of the musculoskeletal system and connective tissue; diseases of the genitourinary system; pregnancy, childbirth and the puerperium; congenital malformations, deformations and chromosomal abnormalities and symptoms, signs and abnormal clinical findings not elsewhere classified. See table D1.23.1 for a full list of ICD-10 codes.
Source: Table D1.23.1. AIHW National Mortality Database.
Leading cause by sex and age
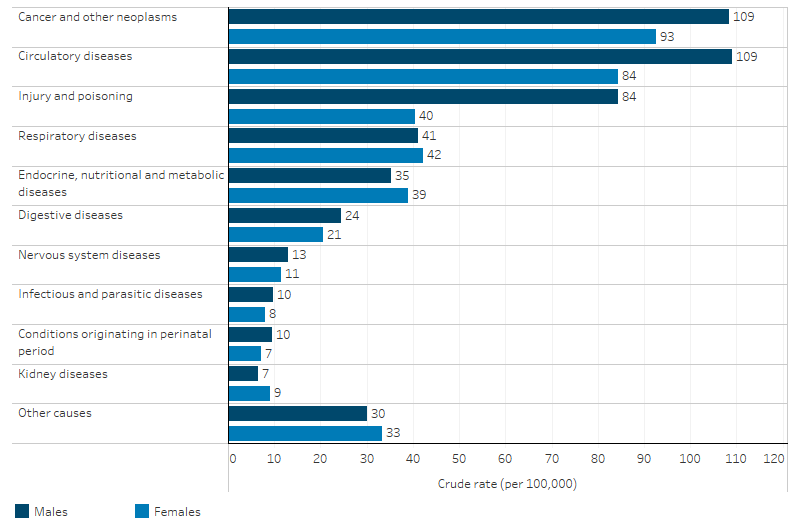
The leading cause of death for Indigenous males was circulatory diseases (closely followed by cancer and other neoplasms), while for Indigenous females it was cancer and other neoplasms (Table D1.23.1, Figure 1.23.2).
Death rates for Indigenous males were higher than for Indigenous females across most leading causes, with the exception of kidney diseases (6.5 compared with 9.1 per 100,000 population) and diabetes (29 compared with 34 per 100,000), where rates were higher for Indigenous females. The relative difference was highest for deaths due to injury and poisoning, with rates for Indigenous males 2.1 times that of Indigenous females (84 and 40 per 100,000, respectively). This was followed by conditions originating in the perinatal period and circulatory diseases with rates for Indigenous males 1.3 times as high as Indigenous females (9.6 compared with 7.2 per 100,000, and 109 compared with 84 per 100,000, respectively).
Death rates due to respiratory diseases; nervous system diseases; infectious and parasitic diseases; and endocrine, nutritional and metabolic diseases were similar for Indigenous males and females (Table D1.23.1, Figure 1.23.2).
Figure 1.23.2: Leading causes of mortality, by sex, Indigenous Australians, NSW, Qld, WA, SA and NT, 2015–2019
Note: ‘Other causes’ includes: diseases of blood and blood-forming organs; mental and behavioural disorders; diseases of the eye and adnexa; diseases of the ear and mastoid process; diseases of the skin and subcutaneous tissue; diseases of the musculoskeletal system and connective tissue; diseases of the genitourinary system; pregnancy, childbirth and the puerperium; congenital malformations, deformations and chromosomal abnormalities and symptoms, signs and abnormal clinical findings not elsewhere classified. See table D1.23.1 for a full list of ICD-10 codes.
Source: Table D1.23.1. AIHW National Mortality Database.
Leading causes of death differed by age. For Indigenous Australians aged 0–4, the leading cause of death was conditions originating in the perinatal period. For those aged 5–44, the leading cause of death was due to injury and poisoning. For those aged 45–54 and 75 and over, the leading cause was circulatory diseases, and for those aged 55–74 it was cancer and other neoplasms (Table D1.23.3).
Leading cause by states and territories
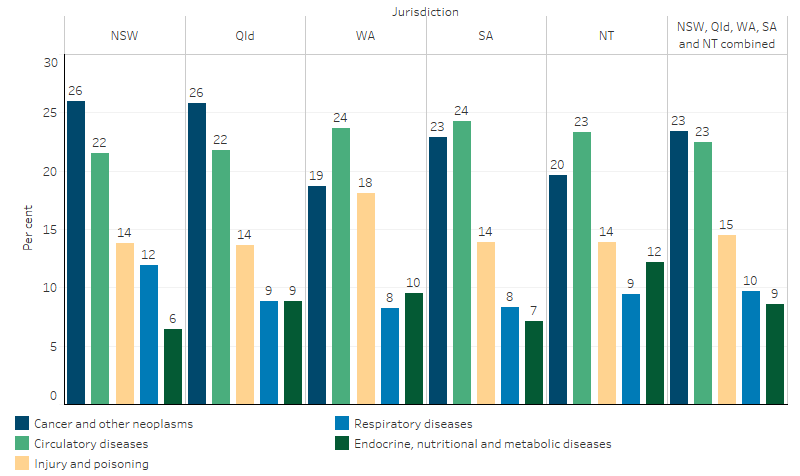
The leading causes of death in the 5 jurisdictions combined were cancer and other neoplasms, circulatory diseases, injury and poisoning, respiratory diseases and endocrine, nutritional and metabolic diseases.
There were some differences across the 5 states and territories in leading causes of death among Indigenous Australians:
- In Queensland and New South Wales, cancer and other neoplasms were the leading cause (accounting for 26% of deaths in each).
- In Western Australia, South Australia and the Northern Territory, circulatory diseases were the leading causes of death for Indigenous Australians, accounting for around one-quarter (23%–24% of deaths).
- Deaths due to injury and poisoning accounted for a higher proportion of deaths in Western Australia (18%) than in the other 4 jurisdictions (14%).
- The proportion of total deaths due to respiratory disease was relatively high in New South Wales (12%), compared with the other 4 jurisdictions (8%–9%), while the proportion due to endocrine, nutritional and metabolic disorders was relatively high in the Northern Territory (12%, compared with 6%–9%) (Table D1.23.2, Figure 1.23.3).
Figure 1.23.3: Leading causes of mortality, by jurisdiction, Indigenous Australians, NSW, Qld, WA, SA and NT, 2015–2019
Source: Table D1.23.2. AIHW National Mortality Database.
Leading causes by remoteness
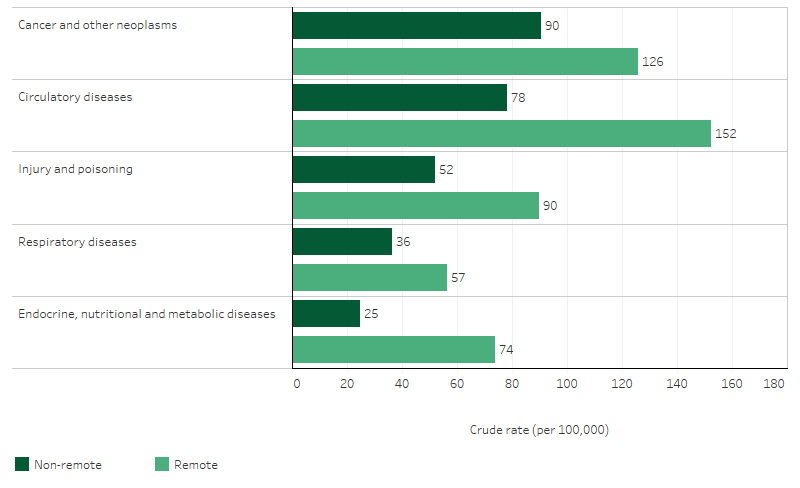
In 2015–2019, for Indigenous Australians, the relative contribution of different leading causes of death in non-remote areas (Major cities, Inner regional and Outer regional areas) differed to that in remote areas (that is, Remote and very remote areas combined):
- In non-remote areas, cancer and other neoplasms accounted for the highest proportion of deaths (25%), followed by circulatory diseases (22%), injury and poisoning (15%), respiratory diseases (10%), and then endocrine, nutritional and metabolic diseases (7%).
- In remote areas, circulatory diseases were the leading cause of death (24%), followed by cancer and other neoplasms (20%), injury and poisoning (14%), and endocrine, nutritional and metabolic diseases (12%), and respiratory diseases (9%).
Among Indigenous Australians, death rates for all 5 leading causes were higher for Indigenous Australians in remote areas than in non-remote areas. The largest relative difference was endocrine, nutritional and metabolic diseases with a rate for remote areas 3 times that of non-remote areas (74 and 25 deaths per 100,000 population) (Table D1.23.30, Figure 1.23.4).
For Indigenous Australians aged under 75, the death rate due to chronic conditions in 2015–2019 was twice as high for those in remote areas than in non-remote areas (324 and 167 per 100,000) (Table D1.23.31).
Figure 1.23.4: Leading causes of mortality, by remoteness, Indigenous Australians, Australia, 2015–2019
Source: Table D1.23.30. AIHW National Mortality Database.
Leading causes of mortality gaps
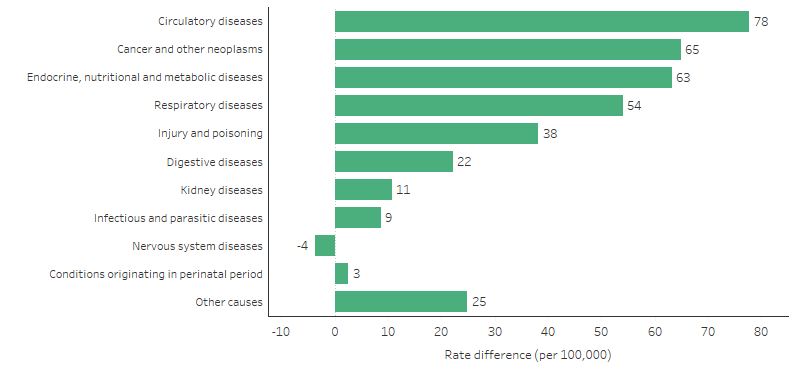
Based on age-standardised rates, circulatory diseases accounted for the largest gap in mortality rates between Indigenous and non‑Indigenous Australians (gap of 78 deaths per 100,000 population). This was followed by cancer and other neoplasms (gap of 65 per 100,000); endocrine, metabolic and nutritional disorders (including diabetes) (gap of 63 per 100,000); and respiratory diseases (gap of 54 per 100,000) (Table D1.23.2, Figure 1.23.5).
Figure 1.23.5: Gap of age-standardised leading causes of mortality between Indigenous and non-Indigenous Australians, NSW, Qld, WA, SA and NT, 2015–2019
Note: ‘Other causes’ includes: diseases of blood and blood-forming organs; mental and behavioural disorders; diseases of the eye and adnexa; diseases of the ear and mastoid process; diseases of the skin and subcutaneous tissue; diseases of the musculoskeletal system and connective tissue; diseases of the genitourinary system; pregnancy, childbirth and the puerperium; congenital malformations, deformations and chromosomal abnormalities and symptoms, signs and abnormal clinical findings not elsewhere classified. See table D1.23.1 for a full list of ICD-10 codes.
Source: Table D1.23.2. AIHW National Mortality Database.
The leading cause contributing to the gap was circulatory diseases in Western Australia, South Australia and the Northern Territory. In New South Wales, the leading cause contributing to the gap was respiratory diseases; while in Queensland it was cancer and other neoplasms (Table D1.23.2).
In Remote and very remote areas combined, circulatory diseases contributed the biggest gap in mortality rates between Indigenous and non-Indigenous Australians (gap of 187 per 100,000). In non-remote areas cancer and other neoplasms were the biggest contributors to the gap (gap of 45 per 100,000) (Table D1.23.30).
Detailed leading causes
This section looks at the specific causes of death within the top 3 leading cause groups which accounted for 60% of all deaths in 2015–2019.
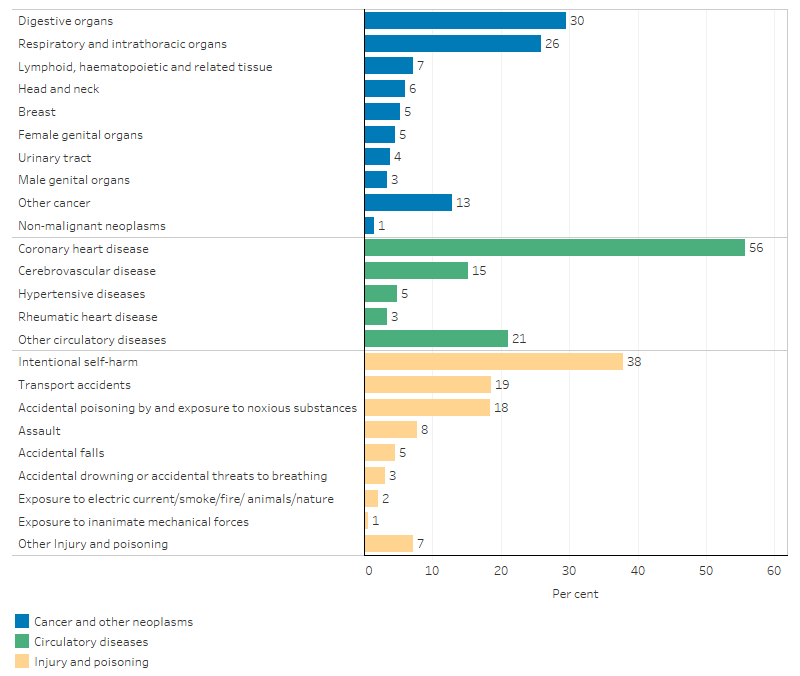
In the 5-year period 2015–2019, there were 3,612 deaths due to cancer and other neoplasms among Indigenous Australians (23% of all deaths); a rate of 101 deaths per 100,000 population. Nearly all (99%) of these deaths were caused by cancer (that is, malignant neoplasms). Among the top contributors to cancer deaths were cancers of the digestive organs (30% of deaths due to cancer and other neoplasms), respiratory and intrathoracic organs (26%), and those of the lymphoid, haematopoietic and related tissues (7%) (Table D1.23.12, Figure 1.23.6). Notably, sex specific cancers such as cancers of the male and female genital organs accounted for 6.2% and 10% of the cancer deaths for males and females, respectively (Table 1.23-1). Just over half (54%) of the deaths due to cancer were for those aged 55–74 (Table D1.23.13).
In 2015–2019, there were 3,471 deaths of Indigenous Australians due to circulatory disease (23% of all deaths), a rate of 97 deaths per 100,000 population. The leading specific causes of circulatory disease deaths were coronary heart disease (also known as ischaemic heart disease), accounting for 56% of circulatory disease deaths (Table D1.23.8, Figure 1.23.6). This was followed by cerebrovascular disease (15%) and hypertensive diseases (4.8%). For coronary heart disease, among Indigenous Australians, people aged 45–64 accounted for a higher proportion of deaths than those aged 65 and over (48% compared with 39%). For cerebrovascular disease and hypertensive diseases, the reverse was true, with people aged 65 and over accounting for higher proportions of the deaths (60% for cerebrovascular and 61% for hypertensive diseases) than those aged 45–64 (31% and 30%, respectively) (Table D1.23.9).
For Indigenous Australians, 2,240 deaths in 2015–2019 were due to injury and poisoning (15% of all deaths), a rate of 62 deaths per 100,000 population (Table D1.23.1). The leading causes of death due to injury and poisoning were suicide (intentional self-harm) (38%), transport accidents (19%) and accidental poisoning (18%) (Table D1.23.10, Figure 1.23.6). Around 75% of all deaths for injury and poisoning were for people aged under 45 (Table D1.23.11).
Figure 1.23.6: Top 3 leading causes of death (cancer and other neoplasms, circulatory diseases and injury and poisoning), by specific cause, Indigenous Australians, NSW, Qld, WA, SA and NT, 2015–2019
Sources: Tables D1.23.8, D1.23.10, D1.23.12. AIHW National Mortality Database.
Table 1.23-1: Detailed causes of death for cancer and other neoplasms, circulatory diseases and injury and poisoning, by sex, Indigenous Australians, NSW, Qld, WA, SA and the NT, 2015–2019
|
Cancer and other neoplasms |
Male deaths |
Male % |
Female deaths |
Female % |
Total deaths |
Total % |
|---|---|---|---|---|---|---|
|
Cancer - malignant neoplasms |
1,925 |
98.9 |
1,638 |
98.3 |
3,563 |
98.6 |
|
Digestive organs |
622 |
32.0 |
448 |
26.9 |
1,070 |
29.6 |
|
Respiratory and intrathoracic organs |
523 |
26.9 |
412 |
24.7 |
935 |
25.9 |
|
Ill-defined and unknown primary sites |
131 |
6.7 |
119 |
7.1 |
250 |
6.9 |
|
Lymphoid, haematopoietic and related tissue |
143 |
7.3 |
116 |
7.0 |
259 |
7.2 |
|
Female genital organs |
. . |
. . |
166 |
10.0 |
166 |
4.6 |
|
Head and neck |
159 |
8.2 |
57 |
3.4 |
216 |
6.0 |
|
Breast |
5 |
0.3 |
187 |
11.2 |
192 |
5.3 |
|
Urinary tract |
88 |
4.5 |
49 |
2.9 |
137 |
3.8 |
|
Male genital organs |
121 |
6.2 |
. . |
. . |
121 |
3.3 |
|
Other specified malignant neoplasms |
133 |
6.8 |
84 |
5.0 |
217 |
6.0 |
|
Non-malignant neoplasms |
21 |
1.1 |
28 |
1.7 |
49 |
1.4 |
|
Total cancer and other neoplasms |
1,946 |
100.0 |
1,666 |
100.0 |
3,612 |
100.0 |
|
Circulatory diseases |
Male deaths |
Male % |
Female deaths |
Female % |
Total deaths |
Total % |
|---|---|---|---|---|---|---|
|
Coronary heart disease |
1,218 |
62.3 |
714 |
47.1 |
1,932 |
55.7 |
|
Acute myocardial infarction |
414 |
21.2 |
293 |
19.3 |
707 |
20.4 |
|
Cerebrovascular disease |
255 |
13.0 |
272 |
17.9 |
527 |
15.2 |
|
Stroke |
201 |
10.3 |
237 |
15.6 |
438 |
12.6 |
|
Other heart disease |
301 |
15.4 |
300 |
19.8 |
601 |
17.3 |
|
Hypertensive disease |
72 |
3.7 |
93 |
6.1 |
165 |
4.8 |
|
Rheumatic heart disease |
40 |
2.0 |
77 |
5.1 |
117 |
3.4 |
|
Other |
69 |
3.5 |
60 |
4.0 |
129 |
3.7 |
|
Total circulatory diseases |
1,955 |
100.0 |
1,516 |
100.0 |
3,471 |
100.0 |
|
Injury and poisoning |
Male deaths |
Male % |
Female deaths |
Female % |
Total deaths |
Total % |
|---|---|---|---|---|---|---|
|
Intentional self-harm |
620 |
41.0 |
227 |
31.3 |
847 |
37.8 |
|
Transport accidents |
289 |
19.1 |
128 |
17.6 |
417 |
18.6 |
|
Accidental poisoning by and exposure to noxious substances |
251 |
16.6 |
162 |
22.3 |
413 |
18.4 |
|
Assault |
109 |
7.2 |
65 |
9 |
174 |
7.8 |
|
Accidental falls |
59 |
3.9 |
42 |
5.8 |
101 |
4.5 |
|
Other Injury and poisoning of accidental injury |
42 |
2.8 |
34 |
4.7 |
76 |
3.4 |
|
Accidental drowning or accidental threats to breathing |
49 |
3.2 |
19 |
2.6 |
68 |
3.0 |
|
Exposure to electric current/smoke/fire/ animals/nature |
n.p. |
n.p. |
n.p. |
n.p. |
48 |
2.1 |
|
Exposure to inanimate mechanical forces |
n.p. |
n.p. |
n.p. |
n.p. |
14 |
0.6 |
|
Other Injury and poisoning |
53 |
3.5 |
29 |
4 |
82 |
3.7 |
|
Total Injury and poisoning of morbidity and mortality |
1,514 |
100 |
726 |
100 |
2,240 |
100 |
Sources: Tables D1.23.8, D1.23.10, D1.23.12.
Changes over time
Based on age-standardised rates, for both Indigenous and non-Indigenous Australians, the leading cause of death over the period 2006 to 2016 shifted from circulatory diseases to cancer and other neoplasms:
- for Indigenous Australians, circulatory diseases were the leading cause of mortality between 2006 and 2016, followed by cancer and other neoplasms. Between 2017 and 2019, this had swapped, with cancer and other neoplasms becoming the leading cause, followed by circulatory diseases.
- for non-Indigenous Australians, circulatory diseases was the leading cause for all years between 2006 and 2014, except 2013 (when cancer and other neoplasms was higher). From 2015 to 2019, cancer and other neoplasms was the leading cause, followed by circulatory diseases (Tables D1.23.18 and D1.23.20).
To describe trends in mortality data, linear regression has been used to calculate the per cent change over time. This means that information from all years of the specified time period are used, rather than only the first and last points in the series (see Statistical terms and methods).
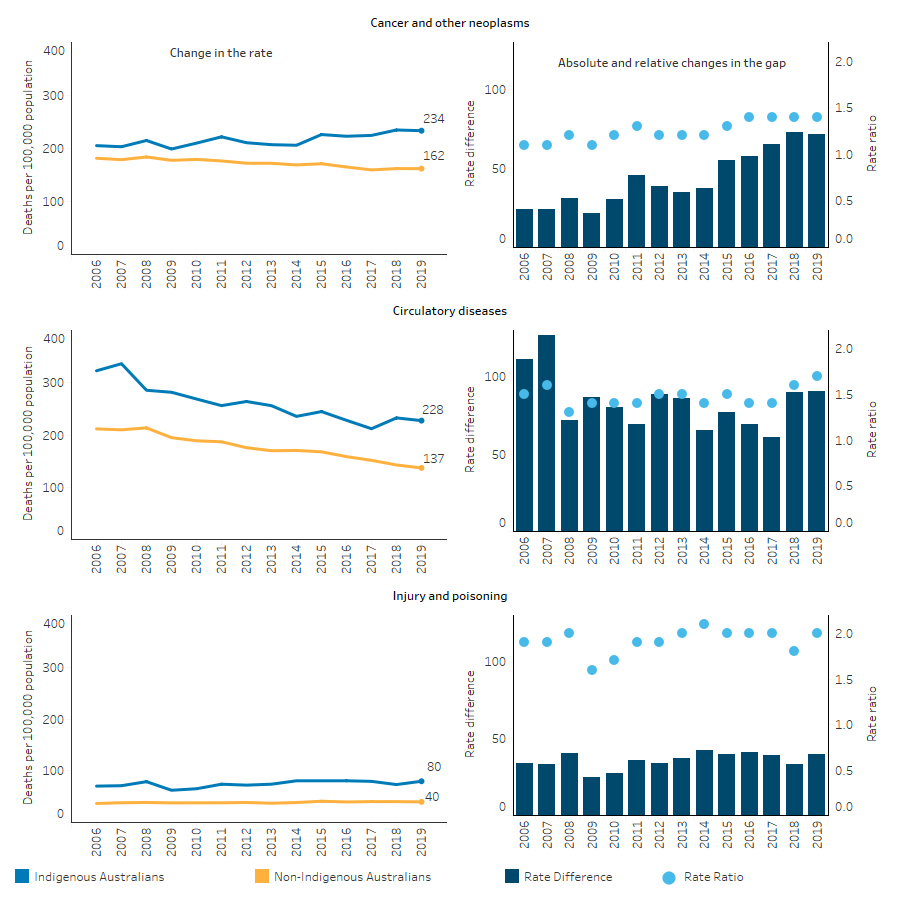
Between 2006 and 2019, the age-standardised death rate for cancer and other neoplasms increased by 14% for Indigenous Australians while the rate decreased by 13% for non-Indigenous Australians. Over the decade from 2010 to 2019, the mortality rate for Indigenous Australians increased by 12% while the non-Indigenous rate decreased by 10%. This resulted in the absolute gap (rate difference) between Indigenous and non-Indigenous Australians widening. The relative difference (rate ratio) in the rates ranged from 1.2 in 2011 to 1.4 in 2019 (Table D1.23.20, Figure 1.23.7).
The age-standardised mortality rate due to circulatory disease decreased by one-third (33%) for Indigenous Australians over the period 2006 to 2019, and by 18% in the decade from 2010 to 2019. The rate also declined for non-Indigenous Australians, and there was no significant change in the gap for either period. The relative difference in the rates over the last decade ranged from 1.4 in 2010 to 1.7 in 2019 (Table D1.23.18, Figure 1.23.7).
Among Indigenous Australians over the period 2006 to 2019, the age-standardised mortality rate due to injury and poisoning increased by 16% while the rate for non-Indigenous Australians increased by 8.3%. Similarly, over the most recent decade the mortality rate for Indigenous Australians almost doubled the percentage increase for non-Indigenous Australians (14% compared with 7.5%). Despite the higher percentage increases for Indigenous Australians there was no significant change in the gap over either period. Between 2010 and 2019 the relative difference in the rates ranged from 1.7 in 2010 to 2.0 in 2019 (Table D1.23.19, Figure 1.23.7).
Figure 1.23.7: Age-standardised mortality rates and changes in the gap for selected causes of death, by Indigenous status, NSW, Qld, WA, SA and NT, 2006 to 2019
Sources: Tables D1.23.18, D1.23.19, D1.23.20. AIHW National Mortality Database.
Over the period 2006 to 2019, there was no significant change in the mortality rate for deaths due to respiratory diseases for Indigenous or non-Indigenous Australians, nor in the gap. However, over the last decade from 2010 to 2019, for Indigenous Australians deaths due to respiratory disease increased by 22%, and the absolute gap between Indigenous and non-Indigenous Australians widened (by 43%). Over the last decade the relative difference in rates ranged between 1.7 times as high for Indigenous Australians as for non-Indigenous Australians (in 2015) and 2.2 times as high (in 2018) (Table D1.23.21).
With the endocrine, nutritional and metabolic diseases group, diabetes accounted for 84% of all deaths (Table D1.23.1). Between 2006 and 2019, there was a 20% decline in the rate of deaths due to diabetes for Indigenous Australians, with no significant change for non-Indigenous Australians over the same period. This resulted in a narrowing of the absolute gap between Indigenous and non-Indigenous Australians (by 24%). Most of these changes occurred in the earlier years in the period as there have been no significant reductions for Indigenous or non-Indigenous Australians over the last decade. The relative difference in rates between Indigenous and non-Indigenous Australians over the last decade ranged from 5.6 times as high for Indigenous Australians in 2012 to 4.3 times as high in 2015 (Table D1.23.22).
Based on age-standardised rates, the mortality rate due to kidney diseases decreased by 60% for Indigenous Australians and by 37% for non-Indigenous Australians over the period 2006 to 2019. As a result, the absolute gap narrowed by 71%. Over the decade from 2010 to 2019, the rate declined by 36% for Indigenous Australians and 26% for non-Indigenous Australians with no significant change in the absolute gap. The relative difference in rates between Indigenous and non-Indigenous Australians over the last decade ranged from 3.2 times as high for Indigenous Australians in 2013 to 1.8 times as high in 2017 (Table D1.23.23).
Research and evaluation findings
The research literature provides a number of insights into the determinants of mortality among Indigenous Australians. It highlights improvements that can be made to the health system, and the social determinants, to reduce disease-specific death rates.
Findings show that improved management of chronic diseases can prevent the development of life-threatening complications. For example, a study of incidence and survival of acute myocardial infarction found that improvement in survival for Indigenous Australians in the Northern Territory was associated with pre-hospital management of conditions. Specialised coronary care services within hospitals, placed a greater emphasis on post-hospital management which led to improved survival rates of patients (You et al. 2009).
Research has found that chronic disease mortality increased with remoteness, reflecting differentials in health-care and socioeconomic status across areas. This finding was consistent across Australia in most states and territories (Chondur et al. 2014).
Multi-morbidity is found to be associated with increased mortality (Fortin et al. 2004), and prevalence of multi-morbidity is higher among Indigenous Australians than non-Indigenous Australians (Broe & Radford 2018; Deborah et al. 2018; Hussain et al. 2018).
- A recent study, based on New South Wales hospital data, found that, after adjusting for age, sex, and socioeconomic status, the prevalence of multi-morbidity among Indigenous Australians was 2.6 times that of non-Indigenous Australians. This difference accounted for a large proportion of the difference in mortality rates between the 2 groups of patients (Deborah et al. 2018).
- The prevalence of multi-morbidity was higher among Indigenous Australians in all age groups. In younger age groups this was because of the higher prevalence of mental morbidities, while in the older age group (over 60 years) it was because of physical morbidities (Broe & Radford 2018).
Studies in the Northern Territory found that the largest gains for the Indigenous Australian population in avoidable mortality were for conditions amenable to medical care such as asthma, pneumonia and breast cancer. However, there was only a marginal change for potentially preventable conditions, such as lung cancer, chronic liver disease and cirrhosis, and motor vehicle accidents (Li et al. 2009).
Another study in the Northern Territory found that socioeconomic disadvantage was the leading determinant for gaps in life expectancy between Indigenous and non-Indigenous Australians, accounting for one-third to one-half of the gap (Zhao et al. 2013).
Some progress has been made since the introduction of the Better Cardiac Care project, which aims to reduce mortality and morbidity from cardiac conditions among Indigenous Australians by increasing access to services, better managing risk factors and treatment, and improving coordination of care. Improvements include:
- The level of access for cardiac-related health services has improved.
- There have been increases in the proportion of Indigenous Australians who received: Medicare-funded health assessments; cardiac-related diagnostic services under Medicare; and the recommended intervention following hospitalisation for a severe heart attack.
- The mortality rate from cardiac conditions is declining for Indigenous Australians (AIHW 2021).
Since the launch of the Lighthouse Hospital Project in 2012, better in-hospital and post-hospital cardiac care has been provided, through improved hospital systems and fostering cultural competence in acute care staff. The project aims to improve the patient journey for Indigenous Australians with heart disease and reduce the impact and incidence of discharge against medical advice (for more information see measure 1.05 Cardiovascular disease and measure 3.08 Cultural competency).
Implications
These findings emphasise the need for significant and concerted efforts to continue improving Indigenous health outcomes, both directly through health interventions and services, and by addressing the cultural and social determinants of health.
The health system can contribute to sustained improvements in partnership with Indigenous Australians, through improving the identification of Indigenous clients, health promotion, early detection, chronic disease management, specialist care, and acute care. Acute care services can save the lives of seriously ill or injured people, and there is scope for improvements in timely access to life-saving emergency care for Indigenous Australians.
Access to effective, culturally competent primary health care, and also to medical specialists, is vital for meeting the health needs of Indigenous Australians, particularly for detecting and managing health conditions so as to prevent hospitalisation and death. Improved management of chronic diseases can prevent the development of life-threatening complications but cannot cure these diseases. Chronic diseases can be prevented through modifying health risk behaviours, such as increased physical exercise (see measure 2.18 Physical activity), reduced consumption of alcohol (see measure 2.16 Risky alcohol consumption), smoking cessation (see measure 2.15 Tobacco use), and better nutrition (see measure 2.19 Dietary behaviours).
High levels of intentional self-harm highlight the need for cross-sectoral approaches to health, self-esteem and social and emotional wellbeing (see measure 1.18 Social and emotional wellbeing).
The National Agreement was developed in partnership between all Australian governments and the Coalition of Aboriginal and Torres Strait Islander Peak Organisations. Each party to the National Agreement has developed their own Implementation Plan and will report annually on their actions to achieve the outcomes of the Agreement. Plans have been developed and will be delivered in partnership with Aboriginal and Torres Strait Islander partners.
The Health Plan, released in December 2021, is the overarching policy framework to drive progress against the Closing the Gap health targets and priority reforms. States, territories and other implementation partners can take flexible approaches to implementing Health Plan priorities. Their approaches will depend on local needs and priorities, led by Aboriginal and Torres Strait Islander people and communities.
Implementation of the Health Plan aims to drive structural reform towards models of care that are prevention and early intervention focused, with greater integration of care systems and pathways across primary, secondary and tertiary care. It also emphasises the need for mainstream services to address racism and provide culturally safe and responsive care, and be accountable to Aboriginal and Torres Strait Islander people and communities.
As part of the National Agreement, the health sector was identified as one of 4 initial sectors for joint national strengthening effort and the development of a 3-year Sector Strengthening Plan. The Health Sector Strengthening Plan (Health-SSP) was developed in 2021, to acknowledge and respond to the scope of key challenges for the sector, providing 17 transformative sector strengthening actions. Developed through strong consultation across the Aboriginal and Torres Strait Islander community-controlled health sector and other Aboriginal and Torres Strait Islander health organisations, the Health-SSP will be used to prioritise, partner and negotiate beneficial sector-strengthening strategies.
The policy context is at Policies and strategies.
References
- AIHW (Australian Institute of Health and Welfare) 2021. Better Cardiac Care measures for Aboriginal and Torres Strait Islander people: Fifth national report 2020. Canberra: AIHW.
- AIHW 2022. Australian Burden of Disease Study: Impact and causes of illness and death in Aboriginal and Torres Strait Islander people 2018. Canberra: Australian Institute of Health and Welfare.
- Broe G & Radford K 2018. Multimorbidity in Aboriginal and non-Aboriginal people. Medical Journal of Australia 209:16-7.
- Chondur R, Li SQ, Guthridge S & Lawton P 2014. Does relative remoteness affect chronic disease outcomes? Geographic variation in chronic disease mortality in Australia, 2002-2006. Australian & New Zealand Journal of Public Health 38:117-21.
- Deborah A, Sanja L, Alys H, Sandra J & Louisa J 2018. Multimorbidity among Aboriginal people in New South Wales contributes significantly to their higher mortality. The Medical journal of Australia 209 19-23.
- Fortin M, Lapointe L, Hudon C, Vanasse A, Ntetu AL & Maltais D 2004. Multimorbidity and quality of life in primary care: a systematic review. Health and Quality of Life Outcomes 2.
- Hussain M, Katzenellenbogen J, Sanfilippo F, Murray K & Thompson S 2018. Complexity in disease management: A linked data analysis of multimorbidity in Aboriginal and non-Aboriginal patients hospitalised with atherothrombotic disease in Western Australia. PloS one 3(8): e0201496.
- Li SQ, Gray N, Guthridge S, Pircher S, Wang Z & Zhao Y 2009. Avoidable mortality trends in Aboriginal and non‐Aboriginal populations in the Northern Territory, 1985‐2004. Australian & New Zealand Journal of Public Health 33:544-50.
- You J, Condon JR, Zhao Y & Guthridge S 2009. Incidence and survival after acute myocardial infarction in Indigenous and non-Indigenous people in the Northern Territory, 1992–2004. The Medical Journal of Australia 190:298-302.

