Key messages
- 60% (7,366) of the deaths of Aboriginal and Torres Strait Islander people aged 0–74 were from avoidable causes in 2015–2019.
- The avoidable mortality rate was higher in Remote and very remote areas (329 per 100,000 population) than in Major cities (142 per 100,000) and Inner and outer regional areas (182 per 100,000) in 2015–2019.
- For Indigenous Australians in 2015–2019, coronary heart disease (21%), diabetes (12%) and suicide and self-inflicted injuries (11%) were the leading causes of avoidable mortality.
- The conditions contributing the most to the avoidable mortality gap between Indigenous and non-Indigenous Australians were coronary heart disease (26% of the gap), diabetes (18% of the gap) and COPD (13% of the gap).
- Indigenous Australians died from avoidable causes at 3.1 times the rate of non-Indigenous Australians in 2015–2019 (based on age-standardised rates).
- From 2006 to 2019, there was a significant decline of 15% in avoidable mortality rates for Indigenous Australians (age-standardised). However, over the last decade (since 2010), there has been no significant change in this rate, nor in the gap between Indigenous and non-Indigenous Australians.
- A study in remote Northern Territory communities between 2002 and 2011 found that higher levels of primary care utilisation for renal disease and ischaemic heart disease reduced avoidable deaths by 72%–75% and 63%–66% respectively. It was also estimated that investing $1 in primary health care in remote Indigenous communities could save between $3.95 and $11.75 in hospital costs.
- The evaluation of Indigenous Australians’ Health Programme (IAHP) found a preventative effect upon hospitalisations from Aboriginal Community Controlled Health Services (ACCHSs) care, while mainstream services can be less effective.
Why is it important?
Avoidable and preventable mortality refers to deaths from conditions that are considered avoidable given timely and effective health care (including disease prevention and population health initiatives) (AIHW 2010; Page et al. 2007). Avoidable deaths have been used in various studies to measure the quality, effectiveness, and accessibility of the health system. Deaths from most conditions are influenced by a range of factors in addition to health system performance, including environmental and social factors and health behaviours.
In July 2020, the National Agreement on Closing the Gap (the National Agreement) identified the importance of making sure Aboriginal and Torres Strait Islander people enjoy long and healthy lives. The National Agreement identified the specific target of closing the gap in life expectancy within a generation by 2031 and several supporting indicators considered to be key drivers of life expectancy such as potentially avoidable mortality (the focus of this HPF measure), all‑cause mortality and leading causes of death (see measures 1.22 All causes age-standardised death rates and 1.23 Leading causes of mortality, respectively, for information on these topics). For the latest data on the Closing the Gap targets, see the Closing the Gap Information Repository.
The new National Aboriginal and Torres Strait Islander Health Plan 2021-2031 (the Health Plan), provides a strong overarching policy framework for Aboriginal and Torres Strait Islander health and wellbeing and is the first national health document to address the health targets and priority reforms of the National Agreement.
Both the National Agreement and the Health Plan are discussed further in the Implications section of this measure.
Data findings
Potentially avoidable deaths are classified using nationally agreed definitions based on cause of death for people aged less than 75. They include deaths from conditions that are potentially preventable through individualised care and/or treatable through existing primary or hospital care (AIHW 2021).
Mortality data in this measure are from 5 jurisdictions for which the quality of Indigenous identification in the deaths data is considered to be adequate: namely, New South Wales, Queensland, Western Australia, South Australia, and the Northern Territory. Data by remoteness are reported for all Australian states and territories combined (see Data sources: National Mortality Database).
In the period 2015–2019, there were 7,366 deaths of Aboriginal and Torres Strait Islander people aged 0–74 from potentially avoidable causes, this equates to a rate of 208 deaths per 100,000 population and represented 60% of all deaths of Indigenous Australians aged 0–74.
After adjusting for differences in the age structure between the 2 populations, Indigenous Australians died from potentially avoidable causes at 3.1 times the rate of non-Indigenous Australians (Table D1.24.1).
Avoidable deaths by sex and age
In the 5-year period 2015–2019, Indigenous males who died from potentially avoidable causes tended to be younger than Indigenous females who died from these causes; 59% of potentially avoidable deaths for Indigenous males occurred before age 55 compared with 51% of deaths for Indigenous females. Overall, Indigenous males were more likely to die from potentially avoidable causes than Indigenous females (243 and 172 per 100,000 population, respectively) (Table D1.24.3).
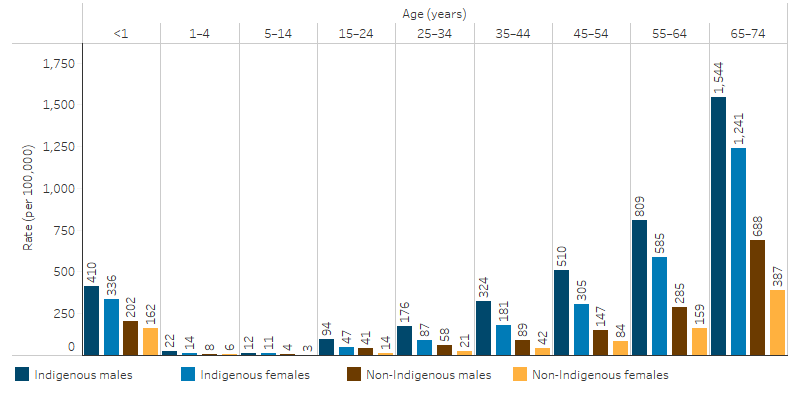
Rates of potentially avoidable deaths were higher for Indigenous Australians than for non-Indigenous Australians across all age groups. The rate of potentially avoidable deaths was highest for Indigenous Australians aged 65–74 (1,383 deaths per 100,000), and this age group also had the largest absolute difference in rates between Indigenous and non-Indigenous Australians (a difference of 848 deaths per 100,000). The relative difference in rates was highest in those aged 35–44, with the rate for Indigenous Australians in this age group 3.8 times as high as the rate for non-Indigenous Australians (251 and 65 deaths per 100,000, respectively) (Table D1.24.3).
Rates of potentially avoidable deaths were higher for Indigenous males than Indigenous females for children aged between 0–4 and in all 10-year age groups between 15 and 74. For those aged 15–24 and 25–34, the rate of potentially avoidable deaths was twice as high for Indigenous males as for Indigenous females (94 compared with 47 deaths per 100,000, and 176 compared with 87 per 100,000, respectively) (Table D1.24.3, Figure 1.24.1).
Figure 1.24.1: Age-specific rates of potentially avoidable deaths, persons aged 0–74, by Indigenous status, age and sex, NSW, Qld, WA, SA and NT, 2015–2019
Source: Table D1.24.3. AIHW National Mortality Database.
Potentially avoidable deaths by jurisdiction
Among Indigenous Australians in 2015–2019, and for the 5 jurisdictions for which Indigenous identification in deaths data is considered adequate:
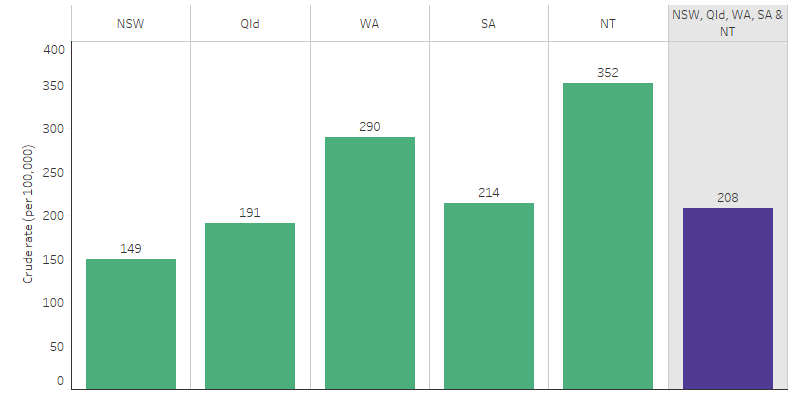
- the rate of potentially avoidable deaths was highest in the Northern Territory (352 deaths per 100,000 population), followed by Western Australia (290 per 100,000), South Australia (214 per 100,000), Queensland (191 per 100,000) and lastly New South Wales (149 per 100,000).
- the rate of potentially avoidable deaths in the Northern Territory was 2.4 times as high as that in New South Wales and 1.8 times that in Queensland (Table D1.24.4, Figure 1.24.2).
Figure 1.24.2: Rates of potentially avoidable deaths, Indigenous Australians aged 0–74, by state and territory, NSW, Qld, WA, SA and NT, 2015–2019
Source: Table D1.24.4. AIHW National Mortality Database.
Potentially avoidable deaths by remoteness
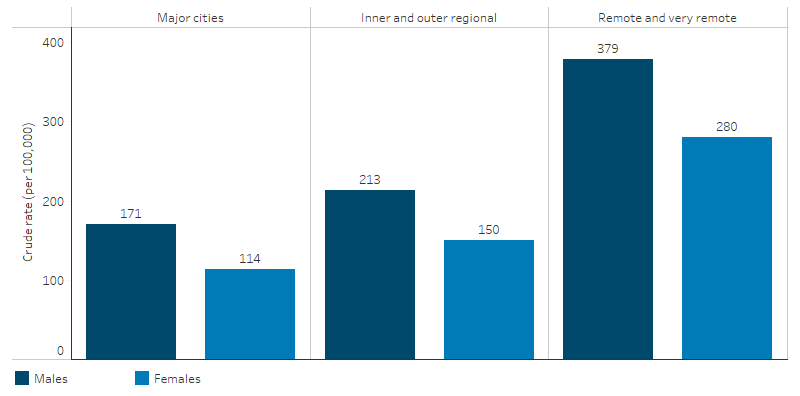
Among Indigenous Australians in 2015–2019, there were 2,152 potentially avoidable deaths in Major cities (a rate of 142 deaths per 100,000 population), 3,217 potentially avoidable deaths in Inner and outer regional areas (182 per 100,000) and 2,435 potentially avoidable deaths in Remote and very remote areas (329 per 100,000).
The mortality rate due to potentially avoidable causes was higher for Indigenous males than Indigenous females across all remoteness areas. For Indigenous males in Major cities, the rate was 1.5 times that of Indigenous females, while the rate in regional and remote areas was 1.4 times that of Indigenous females. For both Indigenous males and females, the rate increased as remoteness increased (Table D1.24.6, Figure 1.24.3).
Indigenous Australians living in Remote and very remote areas had the highest rate of potentially avoidable deaths (329 per 100,000). This was 2.3 times the rate of those living in Major cities (142 per 100,000) and 1.8 times the rate of those living in Inner and outer regional areas (182 per 100,000) (Table D1.24.6).
Figure 1.24.3: Rates of potentially avoidable deaths, Indigenous Australians aged 0–74, by sex and remoteness, Australia, 2015–2019
Source: Table D1.24.6. AIHW National Mortality Database.
Based on age-standardised rates, the gap in potentially avoidable mortality between Indigenous and non-Indigenous Australians was higher in remote areas than in non-remote areas (rate difference of 346 compared with 152 deaths per 100,000 population) (Table D1.24.6).
Causes of avoidable deaths
Of the 7,366 potentially avoidable deaths among Indigenous Australians in the 2015–2019, 21% were due to coronary heart disease, 12% were due to diabetes and 11% were due to suicide and self-inflicted injuries (Table D1.24.5, Figure 1.24.4).
Figure 1.24.4: Potentially avoidable deaths, Indigenous Australians aged 0–74, by cause of death, NSW, Qld, WA, SA and NT, 2015–2019 (per cent)
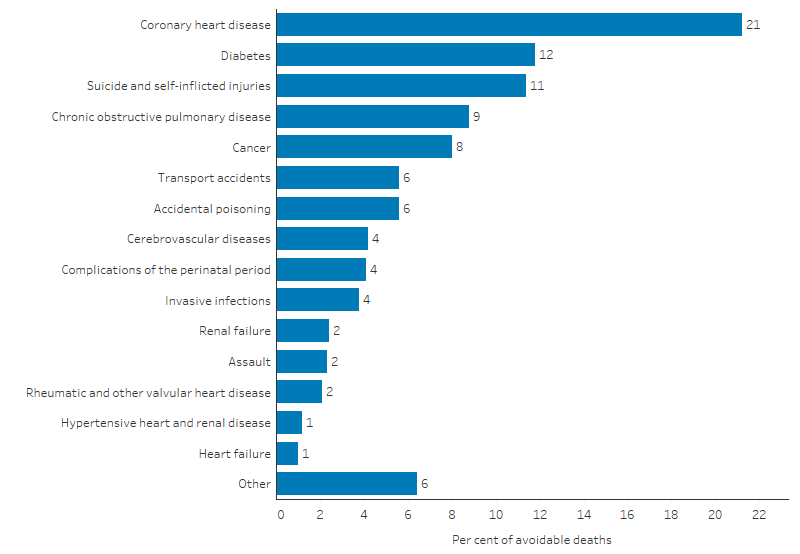
Note: 'Other' includes all nationally defined causes of avoidable mortality not specifically detailed in the figure.
Source: Table D1.24.5. AIHW National Mortality Database.
After adjusting for differences in the age structure between the 2 populations, the conditions contributing most to the gap between Indigenous and non-Indigenous Australians in rates of potentially avoidable deaths were coronary heart disease (26% of the gap in avoidable mortality), diabetes (18% of the gap) and COPD (13% of the gap) (Table D1.24.5).
Changes over time
To describe trends in mortality data, linear regression has been used to calculate the per cent change over time. This means that information from all years of the specified time period are used, rather than only the first and last points in the series (see Statistical terms and methods).
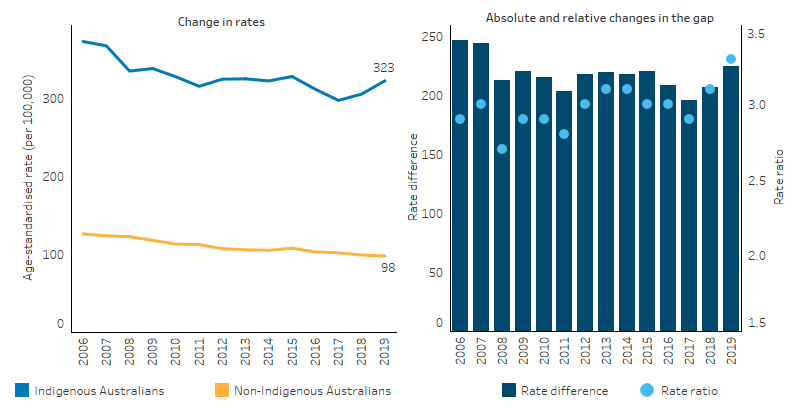
The proportion of all deaths among Indigenous Australians aged 0–74 that were considered potentially avoidable decreased from 64% in 2006 to 60% in 2019 (Table D1.24.7).
Between 2006 and 2019, the age-standardised rate of potentially avoidable deaths decreased by 15% for Indigenous Australians and 23% for non-Indigenous Australians (Table D1.24.2, Figure 1.24.5). Most of these changes occurred in the earlier years in the period. Over the most recent decade from 2010 to 2019, there was no statistically significant change in the rate of potentially avoidable deaths for Indigenous Australians, while for non-Indigenous Australians it decreased by 13%. There was no significant change in the gap over the decade.
Over the last decade, the relative difference in rates between Indigenous and non-Indigenous Australians (rate ratio) ranged between 2.8 in 2011 and 3.3 in 2019 (Table D1.24.2, Figure 1.24.5).
Figure 1.24.5: Age-standardised rates of potentially avoidable deaths and changes in the gap, by Indigenous status, NSW, Qld, WA, SA and NT, 2006–2019
Source: Table D1.24.2. AIHW National Mortality Database.
Research and evaluation findings
A study in the Northern Territory by Li et al. (2009) found that the decline in Indigenous avoidable mortality has been greatest for conditions amenable to medical care, for example, neonatal and paediatric care, antibiotics, immunisation, drug therapies, and improved intensive care and surgical procedures. Unlike in the rate for non‑Indigenous people, only marginal change was found for conditions responsive to public health initiatives, such as those caused by smoking and alcohol consumption—suggesting more targeted and culturally appropriate campaigns are required to benefit Aboriginal people (Li et al. 2009).
A study of Indigenous Australians living in remote Northern Territory communities (Zhao et al. 2014) found that those who utilised primary health care at medium or high levels were associated with greater reductions in hospitalisation and death than those in the low utilisation group. This was a historical cohort study involving a total of 14,184 Indigenous Australians aged 15 and over who lived in remote communities and used a remote clinic or public hospital from 2002 to 2011. Higher levels of primary care utilisation for renal disease reduced avoidable hospitalisations by 82%–85%, deaths by 72%–75%, and years of life lost (YLL) by 78%–81%. For ischaemic heart disease the reduction in avoidable hospitalisation was 63%–78%, deaths by 63%–66% and YLL by 69%–73%. This study also estimated that investing $1 in primary health care in remote Indigenous communities could save between $3.95 and $11.75 in hospital costs in addition to the health benefits for patients.
Hoy et al. (2017) analysed deaths among the Tiwi people on Bathurst and Melville Islands off the coast of the Northern Territory between 1960 and 2010 (Hoy et al. 2017). The study illustrated the epidemiological transition of these communities with improvements in preventable infant deaths leading to changes in the demographic and mortality profile of the population over time. High numbers of infant deaths in the 1960s from diarrhoea, respiratory disease and failure to thrive shifted to deaths in older age groups from chronic lung disease, cardiovascular disease and renal failure. The study also illustrated the Barker Hypothesis (Almond & Currie 2011), showing that many children with low birthweight who were once at greater risk of early death are surviving to adulthood but with enhanced susceptibility to chronic disease. Improvements in birthweights and in the prevention and management of chronic disease will lead to continued improvements in mortality. The study also showed a concerning pattern of deaths among 15–45-year old’s from non-natural causes such as accidents, suicide, and homicide from the mid-1980s and peaking in the early 2000s, suggesting that improvements in socioeconomic determinants as well as health services for these age groups is needed.
One category among the leading causes of avoidable mortality is invasive infections. Research into severe invasive infections in Indigenous children admitted to intensive care units (ICUs) in Australia between 2002 and 2013 was analysed by Ostrowski et al. (2017):
- Invasive infections accounted for 23% of non-elective ICU admissions of Indigenous children. Indigenous children had an admission rate almost 3 times as high as for non-Indigenous children (47.6 per 100,000 children per year compared with 15.9 per 100,000). Staphylococcus aureus was the leading cause in children with sepsis or septic shock and this had much higher rates for Indigenous children than for non-Indigenous children.
- Although ICU case fatality rates were similar for Indigenous children compared with non‑Indigenous children, the population-based mortality rate was more than twice as high for Indigenous children. Indigenous children admitted to ICUs had more severe illness.
- This suggests that although once accessing the ICU death rates were similar, at the population level, Indigenous children are at a much higher risk of death from severe invasive infection.
- A vaccine for Staphylococcus aureus is unlikely to be developed in the near future. Poorer living conditions, remoteness and difficulties in accessing health care may significantly increase the incidence of these infections and their severity. Further research is needed to identify risk factors and develop targeted interventions.
The Australian Burden of Disease Study examined the impact of around 200 fatal and non-fatal diseases and covers disease impact as well as death. Three indicators are used: total burden of disease (measured in disability-adjusted life years or DALY), fatal burden (measured in years of life lost from dying prematurely or YLL) and non-fatal burden (measured in years spent living with a disability or YLD). The results showed that in 2018:
- The main causes of total burden of disease for Indigenous Australians were mental and substance-use disorders (23%), injuries (12%), cardiovascular disease (10%), cancer (9.9%) and musculoskeletal conditions (8%).
- Compared with non-Indigenous Australians the total disease burden (DALY) is 2.3 times higher for Indigenous Australians, the fatal burden (YLL) is 2.5 times higher for Indigenous Australians, and the non-fatal burden (YLD) is 2.1 times higher for Indigenous Australians (AIHW 2022).
The Australian Government Department of Health is undertaking several evaluations of health programs.
The Practice Incentives Program Indigenous Health Incentive (PIP IHI) was introduced in 2010 to support health services to provide improved and more targeted care to Indigenous Australian patients. The introduction of the PIP IHI has led to an increase in the number of health checks provided for Indigenous Australian patients with chronic disease and better access to prescription medicines. Following a national consultation process involving 68 stakeholders and 26 written submissions from peak bodies and health service providers, the Australian Government announced changes to the PIP IHI. These changes are intended to improve continuity of care and health outcomes for Indigenous Australians with chronic disease and streamline administrative requirements for practices (Department of Health 2021).
In 2017, the Australian Government announced it was undertaking a national evaluation of its investment in Aboriginal and Torres Islander primary health care which occurs primarily through the Indigenous Australians’ Health Programme (IAHP). The evaluation has a whole of system, person-centred approach that not only focuses on the appropriateness and effectiveness of the IAHP, but its interactions and influence on other parts of the primary health care and wider health system. It is drawing on the perspectives of Aboriginal and Torres Strait Islander stakeholders at different levels of the system and aims to facilitate learning across these levels. This evaluation is composed of 2 separate pathways, one looking at monitoring and evaluation, and the second looking at economic evaluation.
The monitoring and evaluation pathway is framed by 4 key evaluation questions:
- How well is the IAHP enabling the primary health care system to work for Aboriginal and Torres Strait Islander people?
- What difference is the IAHP making to the primary health care system?
- What difference is the IAHP making to the health and wellbeing of Aboriginal and Torres Strait Islander people?
- How can faster progress be made towards improving the health and wellbeing of Aboriginal and Torres Strait Islander people?
The Department of Health and Aged Care is working with the IAHP Yarnes Health Sector Co-design Group on finalising the evaluation in 2024.
Phase 1 of the economic evaluation pathway has been published (Department of Health 2018) and showed:
- The analysis of national data for this project found a preventative effect upon hospitalisations from Aboriginal Community Controlled Health Services (ACCHSs) care.
- Provision of care through mainstream services is likely to be associated with worse health outcomes for Indigenous Australians because mainstream services provide a less comprehensive and less integrated approach.
- Indigenous Australians may face financial difficulties in accessing mainstream services, and if reliance were to be placed on mainstream services in lieu of ACCHSs, reduced attendance and adherence to treatment is highly likely due to services that may not meet their cultural needs and expectations.
Implications
These findings emphasise the need for significant and concerted efforts to continue improving Indigenous health outcomes, both directly through health interventions and services, and by addressing the cultural and social determinants of health.
The findings indicate the following about reducing avoidable deaths:
- Improvements in avoidable mortality rates are partly a result of advances in health care delivery and improved inter-sectoral services.
- A broad range of risk factors and conditions such as smoking, injury, mental health issues, substance-use disorders, cardiac health, diabetes prevention and treatment, and renal disease all require service responses across the health care continuum from prevention to tertiary care.
- Disparities between Indigenous and non-Indigenous Australians can be seen across disease groups, risk factors, age groups (particularly infants and middle and older ages) and remoteness categories, suggesting that policies to drive service delivery should consider the risk factors of disease, across the life course, and be cognisant of location-specific needs and service gaps.
- The total burden of disease for Indigenous Australians is 2.3 times as high as for non-Indigenous Australians. Higher rates of potentially preventable hospitalisations and avoidable mortality from chronic disease and invasive infections indicate underutilisation of primary health care. This is exacerbated by difficulties accessing health care and the social and environmental determinants of these diseases.
The research and evaluations have shown the role ACCHSs have in providing comprehensive, appropriate and safe care for Indigenous Australians, while mainstream services are less effective. Comprehensive, accessible and well-integrated care is needed, particularly in managing chronic conditions, to prevent hospitalisations and death from avoidable causes. Ensuring services are accessible and appropriate is therefore important to drive further reductions in avoidable deaths.
Understanding the reasons for underutilisation of primary health care at the local level is vital in order to address barriers to accessing care (see measure 3.14 Access to services compared with need) such as distance, cost, availability, and cultural safety.
The Health Plan, released in December 2021, is the overarching policy framework to drive progress against the Closing the Gap health targets and priority reforms. States, territories and other implementation partners can take flexible approaches to implementing Health Plan priorities. Their approaches will depend on local needs and priorities, led by Aboriginal and Torres Strait Islander people and communities.
Implementation of the Health Plan aims to drive structural reform towards models of care that are prevention and early intervention focused, with greater integration of care systems and pathways across primary, secondary and tertiary care. It also emphasises the need for mainstream services to address racism and provide culturally safe and responsive care, and be accountable to Aboriginal and Torres Strait Islander people and communities.
As part of the National Agreement on Closing the Gap, the health sector was identified as one of 4 initial sectors for joint national strengthening effort and the development of a 3-year Sector Strengthening Plan. The Health Sector Strengthening Plan (Health-SSP) was developed in 2021, to acknowledge and respond to the scope of key challenges for the sector, providing 17 transformative sector strengthening actions. Developed through strong consultation across the Aboriginal and Torres Strait Islander community-controlled health sector and other Aboriginal and Torres Strait Islander health organisations, the Health SSP will be used to prioritise, partner and negotiate beneficial sector-strengthening strategies.
The policy context is at Policies and strategies.
References
- AIHW (Australian Institute of Health and Welfare) 2010. National Healthcare Agreement: P20-Potentially avoidable deaths 2010. Canberra: AIHW.
- AIHW 2021. Deaths in Australia. (ed., AIHW). Canberra.
- AIHW 2022. Australian Burden of Disease Study: Impact and causes of illness and death in Aboriginal and Torres Strait Islander people 2018. Canberra: Australian Institute of Health and Welfare.
- Almond D & Currie J 2011. Killing me softly: The fetal origins hypothesis. Journal of economic perspectives 25:153-72.
- Department of Health (Australian Government Department of Health) 2018. Economic Evaluation of the Indigenous Australians’ Health Programme Phase 1 Report. Canberra: Department of Health.
- Department of Health 2021. Practice Incentives Program – Indigenous Health Incentive. (ed., Department of Health). Canberra: Department of Health.
- Hoy WE, Mott SA & McLeod BJ 2017. Transformation of mortality in a remote Australian Aboriginal community: a retrospective observational study. BMJ Open 7:e016094.
- Li SQ, Gray N, Guthridge S, Pircher S, Wang Z & Zhao Y 2009. Avoidable mortality trends in Aboriginal and non‐Aboriginal populations in the Northern Territory, 1985‐2004. Australian & New Zealand Journal of Public Health 33:544-50.
- Ostrowski JA, MacLaren G, Alexander J, Stewart P, Gune S, Francis JR et al. 2017. The burden of invasive infections in critically ill Indigenous children in Australia. The Medical Journal of Australia, 206:78-84.
- Page A, Ambrose S, Glover J & Hetzel D 2007. Atlas of Avoidable Hospitalisations in Australia: ambulatory care-sensitive conditions. Adelaide: PHIDU.
- Zhao Y, Thomas S, Guthridge S & Wakerman J 2014. Better health outcomes at lower costs: the benefits of primary care utilisation for chronic disease management in remote Indigenous communities in Australia's Northern Territory. BMC health services research 14:463.

