Key messages
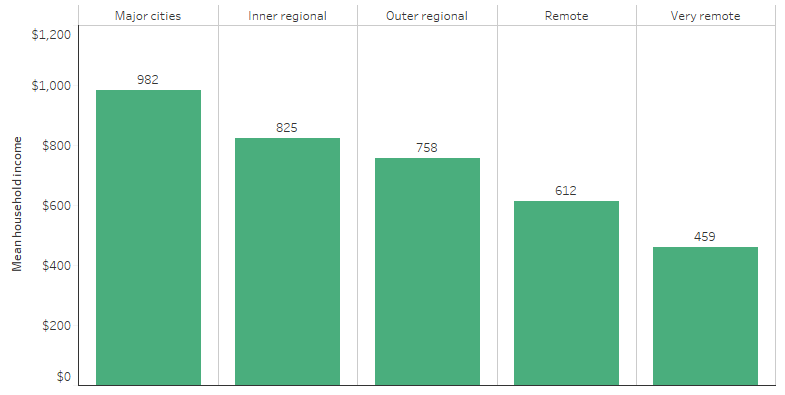
- The median gross weekly equivalised household income for Aboriginal and Torres Strait Islander adults was $825 in 2021. This ranged from $982 in Major cities to $459 in Very remote areas.
- The proportion of Indigenous adults with household income in the lowest quintile was higher in more remote areas, ranging from 26% in Major cities to 69% in Very remote areas, with a national average of 35%. The proportion of Indigenous adults with household income in the highest quintile ranged from 13% in Major cities to 3.0% in Very remote areas, with a national average of 9.9%.
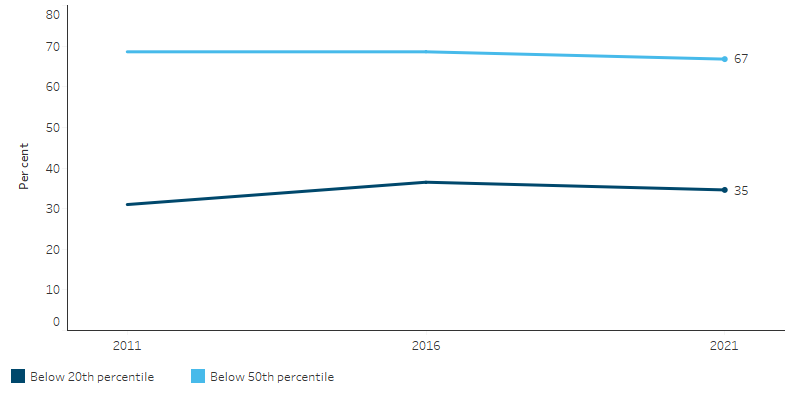
- Over time, the proportion of Indigenous adults living in households with an equivalised income below the 50th percentile (in the lower half of the income distribution) declined from 69% in 2011 to 67% in 2021.
- Indigenous adults had a lower median gross household weekly income than non-Indigenous adults ($825 compared with $1,141). The gap in the median gross weekly equivalised household income between Indigenous and non-Indigenous adults was $316 in 2021, a decrease since 2016 (a gap of $332) and 2011 (a gap of $379).
- Indigenous Australians are proportionally over-represented in lower income bands. In 2021, 35% of Indigenous adults were living in households in the bottom 20% of the household income distribution (compared with 20% of non-Indigenous adults). Looking at personal weekly income, 43% of Indigenous adults had a gross weekly income of under $500, compared with 31% of non-Indigenous adults.
- In 2018–19, based on the National Aboriginal and Torres Strait Islander Health Survey, 40% (153,700) of Indigenous adults were living in households that had experienced days without the money for basic living expenses, such as for food, clothing and bills, in the previous 12 months.
- In 2018–19, when compared with those in households in the two highest income quintiles, Indigenous adults living in households in the lowest income quintile were less likely to have completed Year 12 (21% compared with 53%,), less likely to have a non-school qualification (42% compared with 72%), and less likely to be employed (16% compared with 91%).
- Indigenous adults living in households in the lowest income quintile in 2018–19, when compared with those in households in the two highest income quintiles, were more likely to be a current smoker (57% compared with 23%), have fair or poor health (32% compared with 13%, respectively), and have high psychological distress (44% compared with 18%, respectively).
- The disparity in incomes between Indigenous and non-Indigenous Australians has important implications for health. These implications include reduced capacity to access goods and services required to lead a healthy lifestyle, such as adequate nutritious food, housing, transport and health care.
Why is it important?
Adequate and reliable income allows a person to support themselves, their family and their community (AIHW 2019). Income inequality is associated with poor health and social dysfunction, such as psychological distress, poor education performance, substance misuse, crime and violence (Isaacs et al. 2018; Kessels et al. 2020; Wilkinson & Pickett 2009). Low income can limit choices and opportunities for improving health outcomes and may influence other health-related factors, such as dietary choices and access to health care (AIHW 2015).
Aboriginal and Torres Strait Islander people disproportionately receive a government cash pension or allowance as their main source of income compared to non-Indigenous Australians.
Disparities in income can help explain both the gaps in the average health status of Indigenous and non-Indigenous Australians, and also the wide variation observed in the health outcomes within the Indigenous population (AIHW 2016). People with lower socioeconomic status bear a significantly higher burden of disease (Vos et al. 2009). The association between health and income is also a key component of the socioeconomic gradient in health status (the link between health outcomes and socioeconomic status) that is observed in Australia and other countries (Marmot 2002; Marmot et al. 2008; Pickett & Wilkinson 2015).
Disparity in income is one aspect of socioeconomic status through which Indigenous Australians face disadvantage. Income is closely linked to other factors (Deaton 2003) but particularly employment status as it provides the person with a source of income (see measure 2.07 Employment), and educational attainment (see measures 2.04 Literacy and numeracy, 2.05 Education outcomes for young people and 2.06 Educational participation and attainment of adults).
Data findings
Household income quintiles
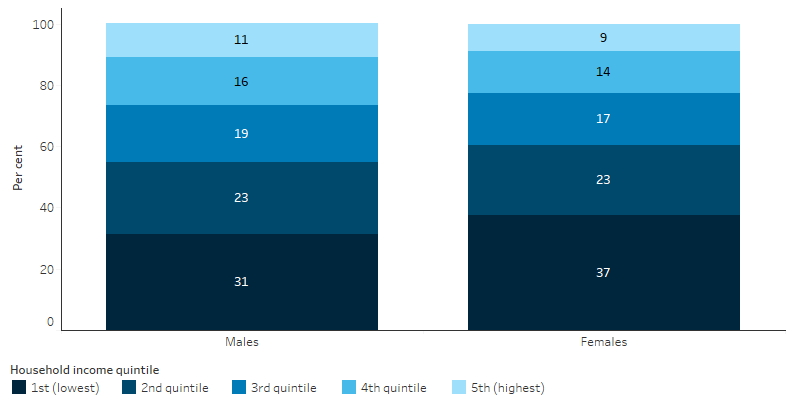
Data from the 2021 Census of Population and Housing show that just over 1 in 3 (35%) Aboriginal and Torres Strait Islander adults (aged 18 and over) were living in households in the bottom 20% of the household income distribution for all Australian adults (lowest quintile). One in 10 (9.9%) of Indigenous adults were living in households in the top 20% of the household income distribution for all Australian adults (highest quintile).
A higher proportion of Indigenous females (37%) lived in households in the lowest income quintile than Indigenous males (31%) (Table D2.08.14, Figure 2.08.1).
Figure 2.08.1: Proportion of Indigenous persons aged 18 and over in each equivalised gross weekly household income quintile, by sex, 2021
Source: Table D2.08.14. ABS Census of Population and Housing, data provided by the ABS, customised report, 2023.
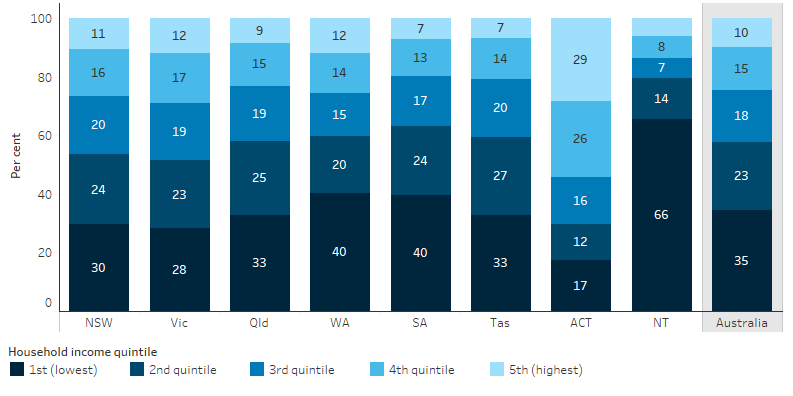
The proportion of Indigenous Australians aged 18 and over living in households in the lowest income quintile ranged from 17% (844 adults) in the Australian Capital Territory to 66% (19,454) in the Northern Territory. The proportion of Indigenous adults living in the highest income quintile ranged from 6% (1,784) in the Northern Territory to 29% (1,387) in the Australian Capital Territory (Table D2.08.15, Figure 2.08.2).
Figure 2.08.2: Proportion of Indigenous adults in each equivalised gross weekly household income quintile, by jurisdiction, 2021
Source: Table D2.08.15. ABS Census of Population and Housing, data provided by the ABS, customised report, 2023.
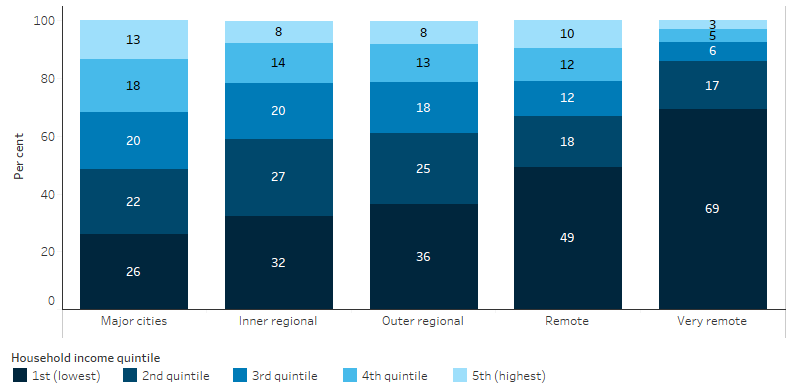
Across remoteness areas, the proportion of Indigenous adults with equivalised household income in the lowest quintile increased with remoteness: 26% in Major cities compared with 69% in Very remote areas. The proportion of Indigenous adults with household income in the highest quintile ranged from 13% in Major cities to 3% in Very remote areas (Table D2.08.17, Figure 2.08.3).
Figure 2.08.3: Proportion of Indigenous adults in each equivalised gross weekly household income quintile, by remoteness, 2021
Source: Table D2.08.17. ABS Census of Population and Housing, data provided by the ABS, customised report, 2023.
Average household income
The 2021 Census reports that the median gross weekly equivalised household income of Indigenous adults (aged 18 and over) was $825. The mean gross weekly equivalised household income for Indigenous adults was $1,005.
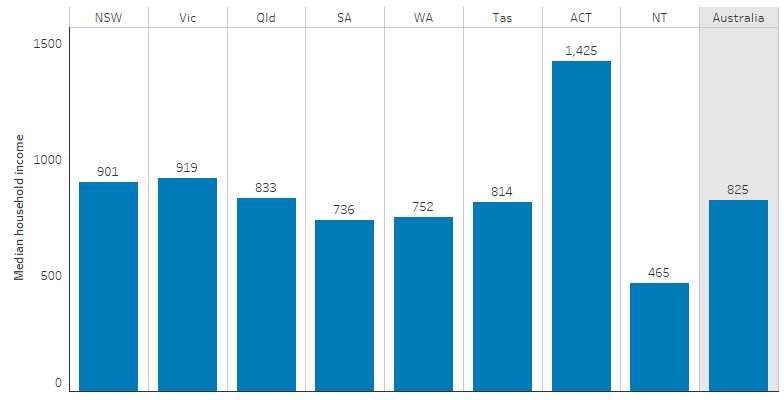
Across jurisdictions, the median gross weekly equivalised household income of Indigenous adults ranged from $465 in the Northern Territory to $1,425 in the Australian Capital Territory (Table D2.08.11, Figure 2.08.4).
Figure 2.08.4: Median gross weekly equivalised household income of Indigenous adults, by jurisdiction, 2021
Source: Table D2.08.11. ABS Census of Population and Housing, data provided by the ABS, customised report, 2023.
By remoteness, the 2021 median gross weekly equivalised household income for Indigenous adults ranged from $982 in Major cities to $459 in Very remote areas (Table D2.08.12, Figure 2.08.5).
Figure 2.08.5: Median gross weekly equivalised household income of Indigenous adults, by remoteness, 2021
Source: Table D2.08.12. ABS Census of Population and Housing, data provided by the ABS, customised report, 2023.
Personal income
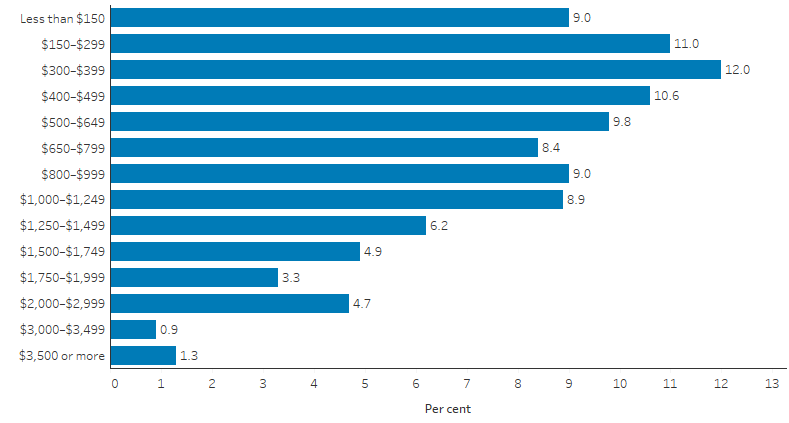
Personal income data from the 2021 Census shows that the median personal income for Indigenous Australians (aged 15 and over) in 2021 was $540 per week (ABS 2022b). These data also show that 43% of Indigenous adults (aged 18 and over) had a gross weekly income of under $500, 27% earned $500–$999, 15% earned $1,000–$1,499, and the remaining 15% earned $1,500 or more (Table D2.08.18, Figure 2.08.6).
Figure 2.08.6: Gross weekly personal income of Indigenous adults, 2021
Source: Table D2.08.18. AIHW analysis of ABS Census of Population and Housing.
Source of income
Data from the 2018–19 National Aboriginal and Torres Strait Islander Health Survey show that the main sources of income for Indigenous Australians aged 18–64 were employee cash income (44%; 195,700) and government cash pension or allowance (45%; 200,200). Comparisons with non-Indigenous Australians were not available for the 2018–19 Health Survey. However, based on responses from the 2014–15 National Aboriginal and Torres Strait Islander Social Survey, 47% of Indigenous Australians aged 18–64 received a government cash pension or allowance as their main source of income, compared with 14% of non-Indigenous Australians (Table D2.08.4).
In 2018–19, Indigenous females were more likely to receive a government cash payment or allowance than Indigenous males (63% compared with 44%) (Table D2.08.5).
Financial stress
In 2018–19, based on the National Aboriginal and Torres Strait Islander Health Survey, 40% (153,700) of Indigenous adults were living in households that had experienced days without the money for basic living expenses, such as for food, clothing and bills, in the previous 12 months (Table D2.08.7).
Additionally, 54% (164,170) of Indigenous Australians were living in households that reported they would not be able to raise $2,000 within a week for an emergency (an indicator of financial stress). This was more likely for households in remote areas (75%) than for those in non-remote areas (49%) (Table D2.08.6).
Income and health
Data from the 2018–19 National Aboriginal and Torres Strait Islander Health Survey showed an association between low income and poorer health. Indigenous adults living in households in the lowest income quintile (1st), when compared with those in households in the two highest income quintiles (4th and 5th), were more likely to report:
- being a current smoker (57% compared with 23%, respectively),
- having fair or poor health (32% compared with 13%, respectively) (see measure 1.17 Perceived health status),
- high psychological distress (44% compared with 18%, respectively), and
- having three or more long-term health conditions (56% compared with 45%, respectively) (Table D2.08.8, Table D2.08.9).
Income, education and employment
The 2018–19 National Aboriginal and Torres Strait Islander Health Survey showed associations of income with educational attainment and employment. Indigenous adults living in households in the lowest income quintile, when compared with those in households in the two highest income quintiles, were less likely to:
- have completed Year 12 (21% compared with 53%, respectively),
- have a non-school qualification (42% compared with 72%, respectively), and
- be employed (16% compared with 91%, respectively) (Table D2.08.7).
Comparisons with non-Indigenous Australians
Data from the 2021 Census show that Indigenous Australians are over-represented in the lower household income distributions, with 35% of Indigenous adults living in households in the bottom 20% of the household income distribution compared with 20% of non-Indigenous adults).
A higher proportion of females than males lived in households in the lowest income quintile for both the Indigenous and non-Indigenous populations. The proportion was 37% for Indigenous females compared with 31% for Indigenous males, and 21% for non-Indigenous females compared with 18% for non-Indigenous males (Table D2.08.14).
The median gross weekly equivalised household income for Indigenous adults was $825 compared with $1,141 for non-Indigenous adults. Across jurisdictions, the greatest difference between median gross weekly equivalised household income for Indigenous and non-Indigenous adults was in the Northern Territory, where Indigenous adults received less than a third of the amount of non-Indigenous adults ($465 and $1,485, respectively) (Table D2.08.11).
Personal income data shows that, similar to household incomes, Indigenous adults were generally over-represented in lower income bands and under-represented in higher income bands. In 2021, 43% of Indigenous adults had a gross weekly income of under $500, compared with 31% of non-Indigenous adults, while 7% of Indigenous adults earned $2,000 or more, compared with 14% of non-Indigenous adults (Table D2.08.18).
Change over time
Household income quintiles
The 2021 Census showed that 35% of Indigenous people aged 18 and over lived in households in the lowest income quintile (below the 20th percentile). This was higher than in the 2011 Census (31%), though lower than in 2016 (37%) (Table D2.08.16).
The proportion of Indigenous adults living in households with an equivalised income below the 50th percentile (in the lower half of the income distribution) declined slightly from 69% in 2011 to 67% in 2021 (Table D2.08.16, Figure 2.08.7).
Figure 2.08.7: Proportion of Indigenous adults who were below the 20th and 50th percentiles of equivalised gross weekly household income, 2011, 2016 and 2021
Source: Table D2.08.16. ABS Census of Population and Housing, data provided by the ABS, customised report, 2023.
Median household income
At the 2021 Census, the median gross weekly equivalised household income for Indigenous adults was $825. This was an increase from $691 in 2016 and $619 in 2011, after adjusting for inflation. The gap in the median gross weekly equivalised household income between Indigenous and non-Indigenous adults was $316 in 2021, a decrease since 2016 (gap of $332) and 2011 (gap of $379) (Table D2.08.13, Figure 2.08.8).
Figure 2.08.8: Median gross weekly equivalised household income of Indigenous adults, 2011, 2016 and 2021
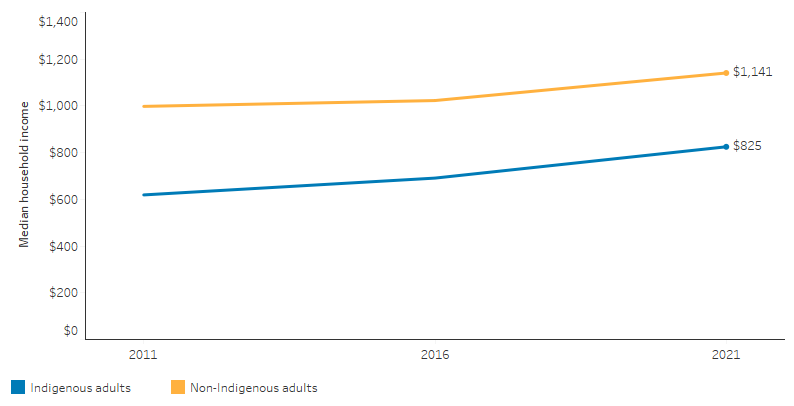
Note: Data for years prior to 2021 are CPI-adjusted.
Source: Table D2.08.13. ABS Census of Population and Housing, data provided by the ABS, customised report, 2023.
Research and evaluation findings
A study found that Indigenous Australians had lower total personal incomes than non-Indigenous Australians across all labour force categories, particularly for those who were employed full-time (Howlett et al. 2015). This was partly due to lower wages (around 18% lower for Indigenous men), which can be explained by lower levels of education, poorer access to ’good’ jobs and fewer weeks worked per year on average. This paper found that Indigenous Australians had considerably less income from other private sources (business and investment income) than non-Indigenous Australians. A higher proportion of Indigenous incomes come from government payments.
Many factors can be attributed to explaining how income affects socioeconomic status and the reason why low income contributes to poor health. Examples include the capacity to afford nutritious food and quality housing; cost barriers to accessing health care, including health insurance; risk behaviours, including substance use and social participation; and access to education and employment (Marmot 2016; World Health Organization 2017).
However, the relationship between health and income is complex and intertwined. Both aspects of health and income can be an outcome or a determinant (Bhattacharya et al. 2013; World Health Organisation 2014). For example, people with higher incomes may have better health outcomes because they have better access to health services, while people with poorer health may have lower incomes due to work limitations caused by their health conditions (AIHW 2015).
Socioeconomic variables (such as weekly cash income, source of cash income, and years of schooling) can explain between one-third and one-half of the gap in self-assessed health status between Indigenous Australians and non-Indigenous Australians (Booth & Carroll 2008). However, several studies that examined health status found a positive relationship with education, labour force status and home ownership, but the evidence for household income was weaker (Chikritzhs & Brady 2006; Cunningham et al. 1997; Gray et al. 2004; Shepherd et al. 2012; Trewin 2006).
International research has shown the level of income inequality within a society is associated with societal function, for example rates of violence, incarceration, communal trust, feelings of exclusion, stress, and educational performance. The effect on health outcomes is not entirely explained by income inequality, rather it is also impacted by those societal conditions (Marmot 2016; Wilkinson & Pickett 2009; Wolfson et al. 1999).
Children’s health is affected by household income from a young age, and the effects accumulate as they age—the older the child, the more profound the effect (Case et al. 2002). There is, however, limited direct evidence for Indigenous children, although one proxy indicator—low birthweight (see measure 1.01 Low birthweight)—highlights the early impact socioeconomic disadvantage can have on health for many Indigenous children (AIHW 2016).
There is an association between income inequality and perceptions of wellbeing (Cooper et al. 2013). Biddle (2015) found a correlation between income and measures of happiness and sadness for Indigenous males living in non-remote areas (Biddle 2015). However, relationships were weaker for females and those living in remote areas.
In 2006 the Senate Standing Committee on Legal and Constitutional Affairs found compelling evidence that governments in several jurisdictions systematically withheld and mismanaged wages and entitlements for Indigenous Australians over many decades from the late 19th Century through to the 1980s. In addition, there is evidence of Indigenous Australians being underpaid or not paid at all for their work, a practice now referred to as ‘stolen wages’. The ‘stolen wages’ has had intergenerational effects that relates directly to the poverty conditions many Indigenous Australians live in today (Senate Standing Committee on Legal and Constitutional Affairs 2006). Some governments have since put in place reparation schemes, although the lack of records have made it very difficult to determine the full impact of stolen wages (Stolen Wages Taskforce 2008).
Family structure for Indigenous Australians extends beyond the nuclear family concept commonly seen in non-Indigenous contexts, to encompass extended family and community in a collective system of resource sharing that is a testament to their rich cultural heritage (Studies 1995) . This traditional practice underscores community resilience and unity, though it does present challenges in balancing resources in the face of income disparity, which can lead to financial pressure, highlighting the need for equitable resource distribution and support (Davidson et al. 2018).
Venn and others (2020) examined trends in income support payments and Community Development Employment Project (CDEP) income among Indigenous Australians between 1994 and 2014–15 (Venn et al. 2020). In non-remote areas, receipt of social security payments among Indigenous Australians fell between 1994 and 2008. During this period, falls in receipt of social security and CDEP wages were offset by increases in the proportion of people with non-CDEP wages as their main source of income. From 2008 to 2014–15, the level of social security payments in non-remote areas did not change significantly. In remote areas, trends in social security payments have been greatly influenced by the decline of the CDEP scheme. Overall, the proportion of Indigenous Australians on CDEP wages was lower in 2014–15 than in 1994.
There was strong income growth between 2002 and 2008; however, income was stagnating and falling between 2008 and 2014–15 (Venn et al. 2020). The income growth between 2002 and 2008 may be due to the shift in Indigenous Australian’s primary source of income from CDEP wages to non-CDEP jobs. In contrast, the fall in income growth between 2008 and 2014–15 may be due to the stagnating labour market and the demise of the CDEP.
Venn and others (2020) also observed that there was an increase in the proportion of Indigenous Australians without any source of income (Venn et al. 2020). However, the authors noted that without longitudinal data, they could not definitely say what has happened to former income support recipients once they have moved off benefits and whether their incomes and welfare have increased as a result. Nor could they conclude whether moving from one type to another payment may have resulted in stagnating average income.
There are multiple models of welfare quarantining, where a proportion of a person’s welfare payment is income managed and directed towards meeting basic needs such as food, clothing, housing and utilities.
One example is the Family Responsibilities Commission (FRC), operating in five communities in North Queensland (Mossman Gorge, Coen, Aurukun, Hopevale and Doomadgee). Through the FRC Act, powers and responsibilities of the Crown have been shared with Indigenous Australians, so they hold formal decision-making powers enabling them to respond to the needs of individuals and families in their own communities. The FRC provides community-based, community-led intervention and support – outside of and preferably before – potentially more serious state interventions are taken by the justice, child protection, education, or housing services.
The FRC’s income management model is an agile, highly nuanced approach. Under the FRC Act, income management can either be voluntary, where community members can approach the FRC entirely of their own accord to seek Voluntary Income Management (VIM), or by way of Conditional Income Management (CIM). The period of income management is time limited ranging from three to 12 months, and the percentage of a person’s welfare payment protected by income management can vary from 60%, 75% and 90% for the duration of the CIM or VIM.
CIM orders are only made by the FRC after the opportunity has been provided to attend a conference with Local Commissioners – Elders or respected persons from the community. In these circumstances income management is only applied by the FRC as a matter of last resort, to the least intrusive extent where it is warranted based on the individual’s circumstances.
VIM is becoming an increasingly popular tool for those wishing to self-refer to the FRC and where the community member decides for him or herself, the portion of their welfare payments to be protected by income management and the duration of the income management agreement.
A review of the Cape York Welfare Reform income management model found that there is some evidence that income management has contributed to a reduction in alcohol consumption and drug use (Scott et al. 2018). The review also suggests that children’s overall health and wellbeing, and engagement in school outcomes have improved. Income management has been a helpful tool for providing respite from daily living problems (e.g., paying rent, buying food and clothing) and stabilising households in crisis. It also is an effective lever to encourage behavioural change, alleviate financial hardship and a helpful tool for financial management.
Implications
The Australian Government provides long- and short-term income support payments to people who cannot fully support themselves. For many disadvantaged Australians, including Indigenous Australians, income assistance is key in ensuring economic and social wellbeing.
The disparity in incomes between Indigenous and non-Indigenous Australians has important implications for health. These implications include reduced capacity to access goods and services required to lead a healthy lifestyle, such as adequate nutritious food, housing, transport and health care.
Other factors that may exacerbate the situation faced by low income households include resource commitments to extended families and visitors (SCRGSP 2007). Income discrepancies may reflect uneven access to education and employment opportunities. Geographic location, health conditions, disability and caring responsibilities also contribute to disadvantage. Furthermore, there is evidence that labour market discrimination against Indigenous Australians exists, that is, wage and employment differentials, which cannot be explained by educational gaps or other factors (Committee for Economic Development of Australia 2015).
It is also important to note that Indigenous women often take on unpaid care responsibilities within their communities which can have an adverse impact on workforce participation and ability to earn an income. Flexible working arrangements that accommodate these caring roles may facilitate more Indigenous women attaining paid, secure work (Brown et al. 2020).
More detailed longitudinal analysis is required. Previous analyses mainly sought to explain the health gaps between Indigenous and non-Indigenous Australians. Less is known about the role of socioeconomic factors in explaining differences in the health status among Indigenous Australians, including the health status of specific subgroups, such as Indigenous Australians with a disability (AIHW 2016).
There exists a large gap in understanding the implications of income support and its association with health, despite 45% of Indigenous Australians aged 18–64 receiving income support as their primary source of income in 2018–19. Further research is required to understand: the level and adequacy of income support; the characteristics of recipients who leave or remain on income support and their reasons for transitioning out of income support; other sources of income when recipients leave income support; and intergenerational effects (AIHW 2019; Venn et al. 2020).
The policy context is at Policies and Strategies.
References
-
ABS (Australian Bureau of Statistics) 2022a. 2021 Census - counting persons, place of usual residence' [Census TableBuilder Pro product].
-
ABS 2022b. 2021 Australia, Census Aboriginal and/or Torres Strait Islander people QuickStats. Canberra: ABS. Viewed April 2023.
- AIHW (Australian Institute of Health and Welfare) 2015. The health and welfare of Australia’s Aboriginal and Torres Strait Islander peoples 2015. Canberra: AIHW.
- AIHW 2016. Australia's health 2016. Canberra: AIHW.
- AIHW 2019. Income support among working-age Indigenous Australians. Canberra.
- Bhattacharya J, Hyde T & Tu P 2013. Health economics. Macmillan International Higher Education.
- Biddle N 2015. Indigenous Income, Wellbeing and Behaviour: Some Policy Complications. Economic Papers: A journal of applied economics and policy 34:139-49.
- Booth AL & Carroll N 2008. Economic status and the Indigenous/non-Indigenous health gap. Economics Letters 99:604-6.
-
Brown C, D’Almada-Remedios R, Gilbert J, O'leary J & Young N 2020. Gari Yala (Speak the Truth): Centreing the experiences of Aboriginal and/or Torres Strait Islander Australians at work. Sydney NSW.
- Case A, Lubotsky D & Paxson C 2002. Economic status and health in childhood: The origins of the gradient. The American Economic Review 92:1308-34.
- Chikritzhs T & Brady M 2006. Fact or fiction? a critique of the National Aboriginal and Torres Strait Islander Social Survey 2002. Drug and alcohol review 25:277-87.
- Committee for Economic Development of Australia 2015. Addressing entrenched disadvantage in Australia. Melbourne: CEDA.
- Cooper D, McCausland WD & Theodossiou I 2013. Income Inequality and Wellbeing: The Plight of the Poor and the Curse of Permanent Inequality. Journal of Economic Issues 47:939-58.
- Cunningham J, Sibthorpe B & Anderson I 1997. Self-assessed health status, Indigenous Australians, 1994: Occasional paper. Canberra: Australian Bureau of Statistics and National Centre for Epidemiology and Population Health.
-
Davidson P, Saunders P, Bradbury B & et al. 2018. Poverty in Australia 2018. Australian Council of Social Service.
- Deaton A 2003. Health, Income, and Inequality. NBER.
- Gray MC, Hunter B & Taylor J 2004. Health expenditure, income and health status among Indigenous and other Australians. ANU Press.
- Howlett M, Gray M & Hunter B 2015. Unpacking the income of Indigenous and non-Indigenous Australians: Wages, government payments and other income. Canberra: CAEPR.
- Isaacs AN, Enticott J, Meadows G & Inder B 2018. Lower income levels in Australia are strongly associated with elevated psychological distress: Implications for healthcare and other policy areas. Frontiers in Psychiatry 9:536.
- Kessels R, Hoornweg A, Bui TKT & Erreygers G 2020. A distributional regression approach to income-related inequality of health in Australia. International Journal for Equity in Health 19:1-19.
- Marmot M 2002. The influence of income on health: views of an epidemiologist. Health Affairs (Millwood) 21:31-46.
- Marmot M 2016. 2016 Boyer Lectures: Fair Australia: Social Justice and the Health Gap. ABC Radio.
- Marmot M, Friel S, Bell R, Houweling TAJ, Taylor S & Commission Social Determinants H 2008. Closing the gap in a generation: health equity through action on the social determinants of health. The Lancet 372:1661-9.
- Pickett KE & Wilkinson RG 2015. Income inequality and health: A causal review. Social Science & Medicine 128:316-26.
- Scott J, Higginson A, Staines Z, Zhen L, Ryan V & Lauchs M 2018. Strategic review of Cape York Income Management.
- SCRGSP (Steering Committee for the Review of Government Service Provision) 2007. Overcoming Indigenous Disadvantage: Key Indicators 2007 Report. Canberra: Productivity Commission.
- Senate Standing Committee on Legal and Constitutional Affairs 2006. Unfinished Business, Indigenous Stolen Wages. Commonwealth of Australia.
- Shepherd CC, Li J & Zubrick SR 2012. Social gradients in the health of Indigenous Australians. American journal of public health 102:107-17.
- Stolen Wages Taskforce 2008. Reconciling The Past: Government control of Aboriginal monies in Western Australia, 1905-1972. (ed., Department of Indigenous Affairs). Western Australia.
-
Studies AIoF 1995. Families and cultural diversity in Australia. Sydney NSW.
- Trewin D 2006. National Aboriginal and Torres Strait Islander Health Survey, Australia, 2004-05. Australian Bureau of Statistics Canberra.
- Venn D, Biddle N & Sanders W 2020. Trends in social security receipt among Indigenous Australians: Evidence from household surveys 1994-2015.
- Vos T, Barker B, Begg S, Stanley L & Lopez A 2009. Burden of disease and injury in Aboriginal and Torres Strait Islander Peoples: the Indigenous health gap. Int J Epidemiol 38:470-77.
- Wilkinson RG & Pickett KE 2009. Income Inequality and Social Dysfunction. Annual Review of Sociology 35:493-511.
- Wolfson M, Kaplan G, Lynch J, Ross N & Backlund E 1999. Relation between income inequality and mortality: empirical demonstration. British Medical Journal 319:953-5.
- World Health Organisation 2014. Health for the world’s adolescents: a second chance in the second decade. Geneva.
- World Health Organization 2017. The determinants of health. WHO.

