Key messages
- 15,439 deaths of Aboriginal and Torres Strait Islander people were recorded in the 5-year period 2015–2019 (430 deaths per 100,000 population).
- The age-standardised death rate for Indigenous Australians was 1.7 times the rate for non‑Indigenous Australians in 2015–2019.
- Between 2010 and 2019, there was no significant change in the mortality rate for Indigenous Australians and some decline for non-Indigenous Australians resulting in a widening of the gap.
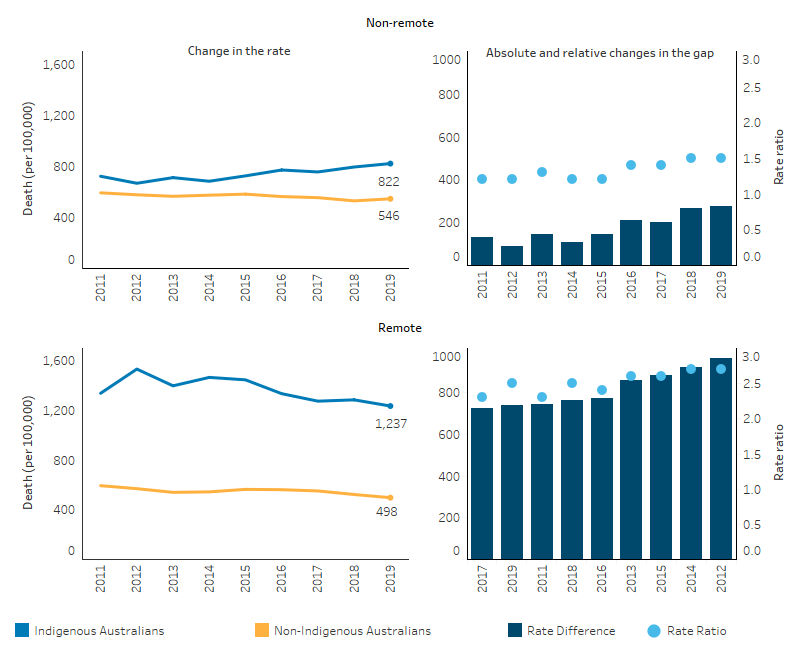
- Between 2011 and 2019, mortality rates for Indigenous Australians decreased by 14% in remote areas but increased by 19% in non-remote areas. The gap between Indigenous and non-Indigenous Australians did not change significantly in remote areas, but approximately doubled in non-remote areas.
- Indigenous Australians aged under 75 experienced higher rates of potential years of life lost due to premature mortality than non-Indigenous Australians.
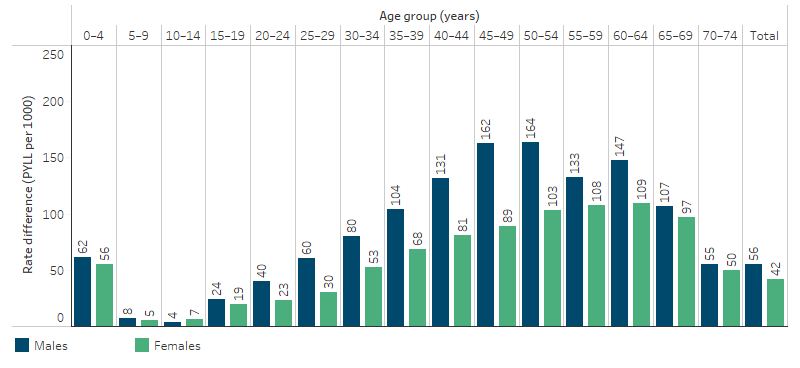
- Based on years of life lost due to premature mortality, the largest gap between Indigenous and non-Indigenous males was in the 50–54 age group (164 potential years of life lost per 1,000 population), while for females it was in the 60–64 age group (109 per 1,000).
Why is it important?
The all-cause age-standardised death rate provides a summary measure of the overall health status of a population. However, it has well-known limitations, there may be delays for many years before improvements in health status lead to reductions in mortality. Mortality statistics also do not reflect the burden of illness in a population for diseases that do not directly result in death. These include arthritis and depression. Despite these limitations, mortality rates are a useful measure with which to compare the overall health status of different populations and to monitor changes in overall health status of populations over time. The all-cause mortality rate for Aboriginal and Torres Strait Islander peoples is 1.7 times that for non-Indigenous Australians, indicating that the overall health status of Indigenous Australians is worse than that of non-Indigenous Australians.
In July 2020, the National Agreement on Closing the Gap (the National Agreement) identified the importance of making sure Aboriginal and Torres Strait Islander people enjoy long and healthy lives. The National Agreement includes the specific target of closing the gap in life expectancy within a generation, by 2031.
The new National Aboriginal and Torres Strait Islander Health Plan 2021-2031 (the Health Plan), provides a strong overarching policy framework for Aboriginal and Torres Strait Islander health and wellbeing and is the first national health document to address the health targets and priority reforms of the National Agreement.
Both the National Agreement and the Health Plan are discussed further in the Implications section of this measure.
As life expectancy estimates are published every 5 years by the Australian Bureau of Statistics (ABS) the National Agreement also identified several supporting indicators, which may be used to direct policy attention and provide proxy information for monitoring progress towards the target in the intervening years (Productivity Commission 2021). One of the supporting indicators for this target is all-cause mortality (the focus of this HPF measure). Other supporting indicators that draw on mortality data are leading causes of death and potentially avoidable mortality rates (see measures 1.23 Leading causes of mortality and 1.24 Avoidable and preventable deaths, respectively, for information on these topics). For the latest data on the Closing the Gap targets, see the Closing the Gap Information Repository.
Data findings
Mortality data in this measure are from 5 jurisdictions for which the quality of Indigenous identification in the deaths data is considered to be adequate: namely, New South Wales, Queensland, Western Australia, South Australia and the Northern Territory. Data by remoteness are reported for all Australian states and territories combined (see Data sources: National Mortality Database). Note that improvements in data quality and changes in the identification of Indigenous status in deaths registrations, as well as the Census-based population estimates (used as denominators for calculating mortality rates) may impact on trends (see Data sources and quality for more information).
During the period 2015–2019, in these 5 jurisdictions, 15,439 deaths were identified as deaths of Indigenous Australians – a crude rate of 430 deaths per 100,000 population.
After adjusting for differences in age structure between the 2 populations, the death rate for Indigenous Australians was 1.7 times the rate for non‑Indigenous Australians (Table D1.22.3). For Indigenous males and females, the death rates were 1.6 and 1.7 times that of non-Indigenous males and females respectively.
By age and sex
Of the 15,439 deaths recorded for Indigenous Australians over the 2015–2019 period, 55% (8,458) were males and 45% (6,981) were females– corresponding to rates of 472 and 388 deaths per 100,000 population, respectively. Death rates for Indigenous males were higher than Indigenous females for all 10-year age groups between 15 and 74. The relative difference in rates was highest in the 25–34 age group, where the rate for Indigenous males was 1.9 times the rate for Indigenous females (Table D1.22.1, Table D1.22.2).
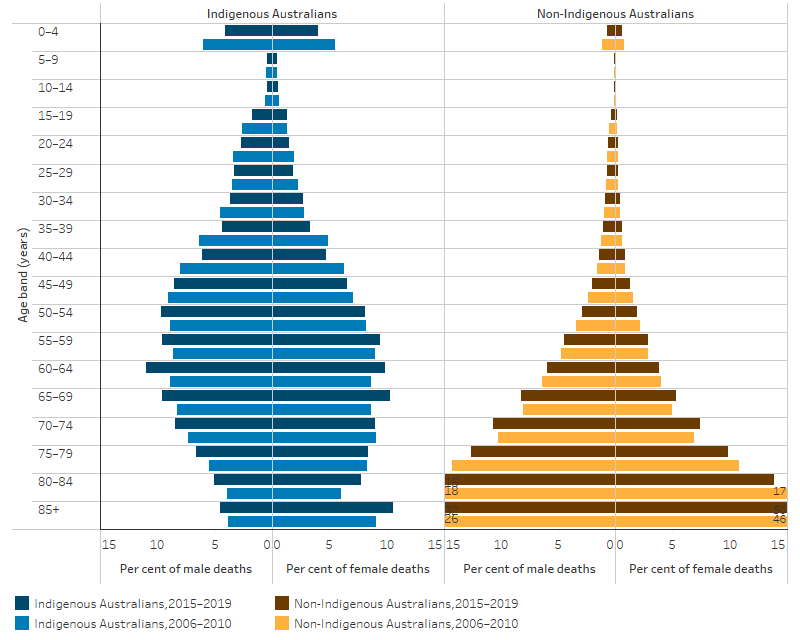
In 2015–2019, the distribution of deaths by age differed for Indigenous males and females. Deaths in all 5-year age groups between ages 15 and 64 accounted for a higher proportion of total male deaths than they did for total female deaths – overall, accounting for 61% of male deaths, compared with 49% of female deaths. In contrast, deaths of those aged 65 and over accounted for a higher proportion of deaths among females than males (46% compared with 34%), while those aged under 15 accounted for as the same proportion of deaths for both males and females (4.9%) (Table D1.22.1, Figure 1.22.1).
Figure 1.22.1: Age distribution of deaths, by sex and Indigenous status, NSW, Qld, WA, SA and the NT, 2015–2019 and 2006–2010
Source: Table D1.22.1. AIHW National Mortality Database.
Comparing 2006–2010 data with that for 2015–2019:
- the percentage of Indigenous males who died at or after age 65 was 5 percentage points higher in 2015–2019 (34% compared with 29% in 2006–2010), as was the case for Indigenous females (46% compared with 41%).
- There were corresponding reductions in the proportion of deaths among those aged under 65, with the largest percentage point reductions for Indigenous males aged 35–39 (2 percentage points) and Indigenous females aged 35–39 and 40–44 (both 1.6 percentage points).
In 2015–2019, Indigenous Australians were more likely to die at a younger age than non‑Indigenous Australians, with 61% of the deaths of Indigenous Australians occurring before age 65 compared with 17% of the deaths of non‑Indigenous Australians. This is a slight improvement of 6 percentage points for Indigenous Australians since 2006–2010 (when it was 66%) and an improvement of 2 percentage points for non-Indigenous Australians (19% in 2006–2010) (Table D1.22.1).
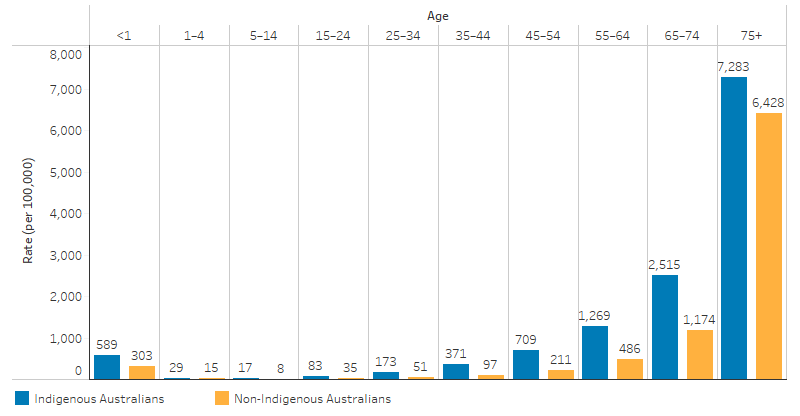
When age-specific rates (per 100,000 population) are examined, the rate of deaths was higher for Indigenous Australians across all age groups compared with rates for non-Indigenous Australians. The largest relative difference in death rates between Indigenous and non-Indigenous Australians was among those aged 35–44, where the death rate for Indigenous Australians was 3.8 times the rate of non‑Indigenous Australians (371 per 100,000 and 97 per 100,000 respectively) (Table D1.22.2, Figure 1.22.2).
Figure 1.22.2: All-cause age-specific death rates, by age and Indigenous status, 2015–2019
Source: D1.22.2. AIHW National Mortality Database.
By state and territory
In 2015–2019, the death rate for Indigenous Australians was lowest for New South Wales (341 per 100,000) and highest for the Northern Territory (659 per 100,000). These jurisdictions also had the smallest and largest relative differences between Indigenous and non-Indigenous Australians – with age-standardised rates for Indigenous Australians that were 1.3 and 2.5 times as high as for non-Indigenous Australians, respectively. Across the remaining 3 jurisdictions included in the analysis, the age-standardised rate was 1.7 times as high for Indigenous Australians as for non-Indigenous Australians in both Queensland and South Australia, and 2.1 times as high in Western Australia (Table D1.22.3).
Potential years of life lost (PYLL)
PYLL considers only deaths that occur before a specified (arbitrary) age. For example, if dying before the age of 75 is considered premature, then a person dying at age 40 would have lost 35 potential years of life.
In 2015–2019, there were 12,206 deaths of Indigenous Australians aged under 75, who collectively had 306,905 potential years of life lost (PYLL). This corresponds to a rate of 87 PYLL per 1,000 population, or an average of 25 PYLL per death.
The rate of PYLL was higher for Indigenous than non-Indigenous Australians in every age group (Figure 1.22.3). The difference in rates of PYLL for Indigenous and non-Indigenous males peaked in the 50–54 age group (164 per 1,000), while for females it peaked in the 60–64 age group (109 per 1,000) (Table D1.22.8, Figure 1.22.3).
Figure 1.22.3: The gap in potential years of life lost before age 75 (PYLL) per 1,000 population between Indigenous and non-Indigenous Australians, by age and sex, 2015–2019
Source: Table D1.22.8. AIHW National Mortality Database.
International comparisons
Death rates are also available for other countries where indigenous people share a similar history of European colonisation, such as New Zealand and the United States. In New Zealand in 2018, the age-standardised death rate for the Māori population was 1.5 times the rate of other New Zealanders (852 and 580 per 100,000, respectively) (Table D1.22.7). In the United States, the mortality rate for American Indians and Alaskan Natives was 1.5 times the rate of non-Hispanic whites during the period 1999–2009 (Espey et al. 2014).
These ratios are similar to the ratio observed in Australia, where the age-standardised death rate for Indigenous Australians in 2015–2019 was 1.7 times the rate for non‑Indigenous Australians.
Caution must be used in comparing Australian data with data for other countries due to variations in data quality, methods applied for addressing data quality issues and definitions for identifying Indigenous peoples.
Changes over time
To describe trends in mortality data, linear regression has been used to calculate the per cent change over time. This means that information from all years of the specified time period are used, rather than only the first and last points in the series (see Statistical terms and methods).
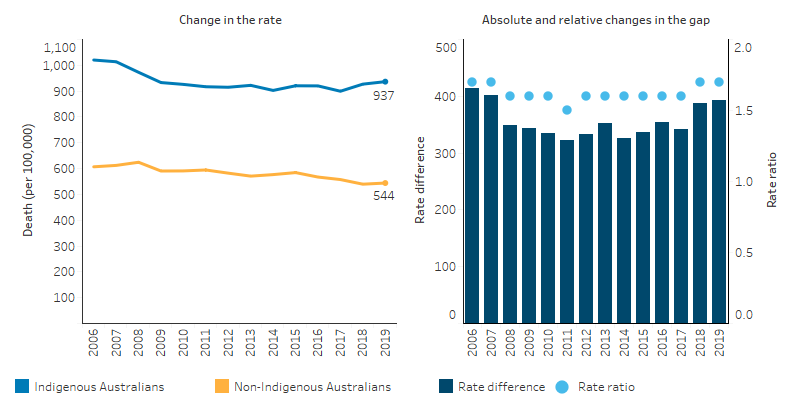
Between 2006 and 2019, the age-standardised all-cause mortality rate significantly decreased by 8.3% and 12% for Indigenous and non-Indigenous Australians, respectively. The absolute gap (rate difference) between Indigenous and non-Indigenous Australians did not change significantly.
Over the decade from 2010 to 2019, the age-standardised all-cause mortality rate did not change significantly for Indigenous Australians but decreased by 8.6% among non-Indigenous Australians. This resulted in a widening of the absolute gap by 18% over this period.
Over the last decade, the relative difference (rate ratio) remained somewhat similar, ranging between 1.5 and 1.7 times as high for Indigenous Australians over the period (Table D1.22.5, Figure 1.22.4).
Figure 1.22.4: Age-standardised death rates and changes in the gap, by Indigenous status, NSW, Qld, WA, SA and NT, 2006 to 2019
Source: Table D1.22.5. AIHW National Mortality Database
By state and territory
For Indigenous Australians over the period 2006 to 2019, the overall decrease in the age-standardised all-cause mortality rate was predominately driven by significant decreases in Western Australia (27%) and the Northern Territory (17%). Rates for non-Indigenous Australians declined in all 5 jurisdictions. The absolute gap between Indigenous and non-Indigenous Australians narrowed in Western Australia (37%) but more than doubled in New South Wales.
Most of these changes occurred in the earlier years in the period. Over the most recent decade from 2010 to 2019, there was no significant change in the rate for Indigenous Australians in any jurisdiction, and no change in the absolute gap between Indigenous and non-Indigenous Australians (based on rate difference) (Table D1.22.6).
By remoteness
For Indigenous Australians, over the period 2011 to 2019, the mortality rate decreased in remote areas but increased in non-remote areas.
Between 2011 and 2019, in Remote and very remote areas combined:
- the death rates for Indigenous Australians decreased significantly for those age groups from 0–4 up to 35–44, with the greatest decline for those aged 5–14 (65%).
- based on age-standardised rates, the death rate for Indigenous Australians in Remote and very remote areas decreased significantly by 14%, while the rate for non-Indigenous Australians also declined, though to a lesser extent (11% decrease).
- there was no significant change in the absolute gap in death rates between Indigenous and non-Indigenous Australians and the relative gap ranged between 2.3 (in 2011) and 2.7 (in 2014) (Table 1.22.11, Figure 1.22.5).
In non-remote areas (that is, Major cities, Inner regional, and Outer regional areas combined), over the period 2011 to 2019:
- the all-cause death rate increased significantly for Indigenous Australians aged 45–54, 55–54 and 75 and over. There was no statistically significant change in other age groups.
- on average, for Indigenous Australians aged between 55–64 the death rate increased by more each year than for those aged 45–54 (29 compared with 17 deaths per 100,000). However, there was a larger percentage increase for those aged 45–54 (30%) than those aged 55–64 (26%), due to the overall lower death rates among the 45–54 age group. The death rate among Indigenous Australians aged 75 and over increased by 22%.
- the all causes age-standardised death rate increased by 19% for Indigenous Australians but decreased by 8% for non-Indigenous Australians. As a result, the absolute gap between Indigenous and non-Indigenous Australians approximately doubled over this period (based on rate difference).
- the relative difference in the all causes age-standardised death rates between Indigenous and non-Indigenous Australians was slightly higher over the period 2016 to 2019 (1.4–1.5 times as high for Indigenous as for non-Indigenous Australians), than in the period 2011 to 2015 (1.2–1.3 times as high) (Table D1.22.11, Figure 1.22.5).
Figure 1.22.5: Age-standardised death rates and changes in the gap, by Indigenous status and remoteness, Australia, 2011 to 2019
Source: Table D1.22.11. AIHW National Mortality Database.
Research and evaluation findings
Hoy et al. (2017) analysed deaths among the Tiwi people on Bathurst and Melville Islands off the coast of the Northern Territory between 1960 and 2010. The study illustrated the epidemiological transition of these communities with improvements in preventable infant deaths leading to changes in the demographic and mortality profile of the population over time. High numbers of infant deaths in the 1960s from diarrhoea, respiratory disease and failure to thrive shifted to deaths in older age groups from chronic lung disease, cardiovascular disease and renal failure. The study also illustrated the Barker Hypothesis, showing that many children with low birthweight who were once at greater risk of early death are surviving to adulthood but with enhanced susceptibility to chronic disease. Improvements in birthweights and in the prevention and management of chronic disease will lead to continued improvements in mortality. The study also showed a concerning pattern of deaths among 15-45 year old’s from non-natural causes such as accidents, suicide, and homicide from the mid-1980s and peaking in the early 2000s, suggesting that improvements in socioeconomic determinants as well as health services for these age groups is needed (Hoy et al. 2017).
The quality of Indigenous status identification in mortality data is only of sufficient quality to publish rates for New South Wales, Queensland, Western Australia, South Australia and the Northern Territory. Changes in Indigenous status identification in data sets make it difficult to distinguish between changes in outcomes and changes in data quality, and therefore hinders drawing conclusions from the available data. Incorrect or inconsistent collection of Indigenous status can lead to undercounting of Indigenous deaths. The Australian Institute of Health and Welfare has produced guidelines to improve the consistent collection of Indigenous status information across health data sets (AIHW 2010). Internationally, research has found that the reliability of self-identification of Indigenous status, while largely a dependable method, is impacted by issues such as internalised racism and the effects of historic policies and practices. It is also difficult to confirm the Indigenous status of a person if they die without third-party identification and this is further complicated by people moving between states or regions and away from place of birth (Freemantle et al. 2015).
A significant amount of research that utilises data linkage techniques demonstrates the value of linked datasets for improving the quality of Indigenous statistics. Data linkage is particularly important for time series reporting, and this benefits from improvements from increased identification by Indigenous Australians and changes in collection methodology (AIHW 2012; Christensen et al. 2014; Draper et al. 2009; Lawrence et al. 2012; Taylor et al. 2012).
Implications
Past reports have shown that the mortality rate of Indigenous Australians decreased during the period 1998 to present. However, it is clear that progress since 2006 has slowed, and in more recent years has plateaued. Much more effort is required to further improve the health status of Indigenous Australians. In particular, continued and enhanced efforts are needed to address the factors that influence maternal and child health, social and emotional wellbeing, and chronic disease. Timely and appropriate access to primary health care is critical to improve prevention, screening, detection and management of chronic disease in order to reduce mortality from causes that are sensitive to population health interventions and medical care. More regional and local data would assist in identifying areas of greatest need and assist in efforts to strengthen the capacity of primary health care services to meet that need.
Analysis of mortality rates by remoteness illustrates the stark disadvantage experienced by Indigenous Australians in remote areas. However, recent increases in Indigenous mortality in non-remote areas needs further unpacking. The findings in this measure (and other measures) highlight the need for continued and enhanced policy effort nationwide to address the health needs of Aboriginal and Torres Strait Islander people and provide impetus for the National Agreement, the Health Plan and the Health Sector Strengthening Plan.
The National Agreement was developed in partnership between all Australian governments and the Coalition of Aboriginal and Torres Strait Islander Peak Organisations. Each party to the National Agreement has developed their own Implementation Plan and will report annually on their actions to achieve the outcomes of the Agreement. Plans have been developed and will be delivered in partnership with Aboriginal and Torres Strait Islander partners.
The Health Plan, released in December 2021, is the overarching policy framework to drive progress against the Closing the Gap health targets and priority reforms. States, territories and other implementation partners can take flexible approaches to implementing Health Plan priorities. Their approaches will depend on local needs and priorities, led by Aboriginal and Torres Strait Islander people and communities.
Implementation of the Health Plan aims to drive structural reform towards models of care that are prevention and early intervention focused, with greater integration of care systems and pathways across primary, secondary and tertiary care. It also emphasises the need for mainstream services to address racism and provide culturally safe and responsive care and be accountable to Aboriginal and Torres Strait Islander people and communities.
As part of the National Agreement, the health sector was identified as one of 4 initial sectors for joint national strengthening effort and the development of a 3-year Sector Strengthening Plan. The Health Sector Strengthening Plan (Health-SSP) was developed in 2021, to acknowledge and respond to the scope of key challenges for the sector, providing 17 transformative sector strengthening actions. Developed through strong consultation across the Aboriginal and Torres Strait Islander community-controlled health sector and other Aboriginal and Torres Strait Islander health organisations, the Health-SSP will be used to prioritise, partner and negotiate beneficial sector-strengthening strategies.
The policy context is at Policies and strategies.
References
- AIHW (Australian Institute of Health and Welfare) 2010. National best practice guidelines for collecting Indigenous status in health data sets. Canberra: AIHW.
- AIHW 2012. An enhanced mortality database for estimating Indigenous life expectancy: A feasibility study.
- Christensen D, Davis G, Draper G, Mitrou F, McKeown S, Lawrence D et al. 2014. Evidence for the use of an algorithm in resolving inconsistent and missing Indigenous status in administrative data collections. Australian Journal of Social Issues 49:423-43.
- Draper G, Somerford P, Pilkington A & Thompson S 2009. What is the impact of missing Indigenous status on mortality estimates? An assessment using record linkage in Western Australia. Australian and New Zealand journal of public health 33:325-31.
- Espey DK, Jim MA, Cobb N, Bartholomew M, Becker T, Haverkamp D et al. 2014. Leading causes of death and all-cause mortality in American Indians and Alaska Natives. The American Journal of Public Health 104 Suppl 3:S303-11.
- Freemantle J, Ring I, Arambula Solomon TG, Gachupin FC, Smylie J, Cutler TL et al. 2015. Indigenous mortality (revealed): the invisible illuminated. American journal of public health 105:644-52.
- Hoy WE, Mott SA & McLeod BJ 2017. Transformation of mortality in a remote Australian Aboriginal community: a retrospective observational study. BMJ Open 7:e016094.
- Lawrence D, Christensen D, Mitrou F, Draper G, Davis G, McKeown S et al. 2012. Adjusting for under-identification of Aboriginal and/or Torres Strait Islander births in time series produced from birth records: Using record linkage of survey data and administrative data sources. BMC medical research methodology 12:90.
- Productivity Commission 2021. Closing the Gap Information repository. (ed., Productivity Commission). Canberra.
- Taylor LK, Bentley J, Hunt J, Madden R, McKeown S, Brandt P et al. 2012. Enhanced reporting of deaths among Aboriginal and Torres Strait Islander peoples using linked administrative health datasets. BMC medical research methodology 12:91.

