
Access to primary health care
Primary health care is delivered in community settings, such as general practices, community health centres, First Nations health services, and allied health practices like physiotherapy. It is usually people’s first point of contact with the health system, and the gateway to specialised health services. The evidence presented in this report shows that there is a relative lack of access to primary health care services in general, and particularly in remote areas where people need health care the most. Moreover, 30% of First Nations people reported that they needed health care but had not seen a health care provider on at least once in the past 12 months.
Use of First Nations-specific primary health care services
The Australian Government provides funding to organisations to provide culturally appropriate primary health care services to First Nations people.
First Nations-specific primary health care services are run by Aboriginal Community Controlled Health Organisations (ACCHOs), state and territory, local health services, or non-government organisations.
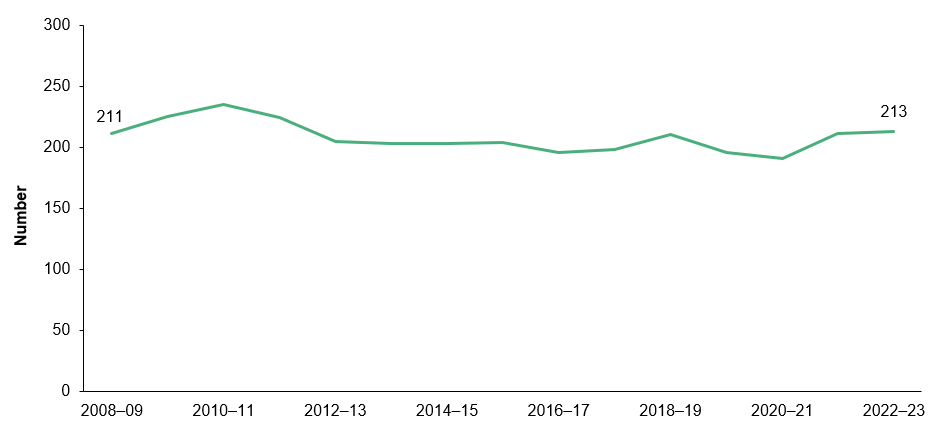
Over the period 2008–09 to 2022–23, the number of First Nations-specific primary health care organisations ranged between 191 and 224 (Figure 6.1). Over the same period the number of episodes of care increased from about 2.1 million in 2008–09 to 3.7 million in 2022–23.
In 2022–23, there were 213 Nations-specific primary health care organisations, of which 69% (or 148) were operated by ACCHOs. First Nations-specific primary health care organisations provided around 3.7 million episodes of care. Of these episodes, 86% (3.2 million) were provided to First Nations clients, and 88% (3.3 million) were provided by ACCHOs (AIHW 2024a).
Figure 6.1: Number of First Nations-specific primary health care organisations, 2008–09 to 2022–23
Notes:
1. Includes primary health care organisations only.
2. Trends over time are affected by changes in which organisations are required to report each period and by changes between periods in how data are collected. For more information see Aboriginal and Torres Strait Islander specific primary health care: results from the OSR and nKPI collections: Technical notes.
Source: Measure 3.14, Table D3.14.47 – AIHW analysis of Service Activity Reporting and AIHW Online Services Report data collections for 2006–07 to 2017–18, and AIHW Online Services Report data collection for 2018–19 to 2022–23 (from: AIHW 2024a).
Although 4 in 5 First Nations people live in Major cities, Inner regional and Outer regional areas where mainstream health services are typically located, these services are not always accessible, for geographic, social, and cultural reasons (AIHW 2016). Further, research indicates that these services outperform mainstream services in terms of identifying and managing risks for chronic conditions (Panaretto et al. 2014). As such, First Nations-specific primary health services are important providers of comprehensive primary health services for First Nations people across geographic areas.
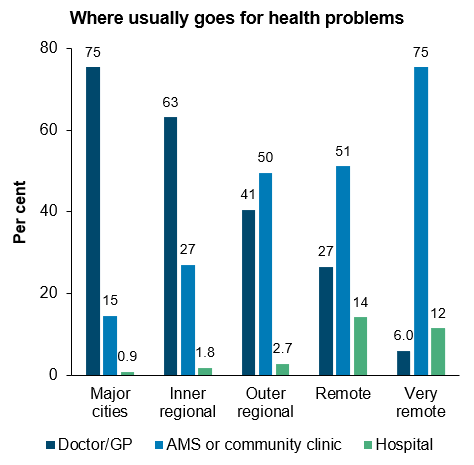
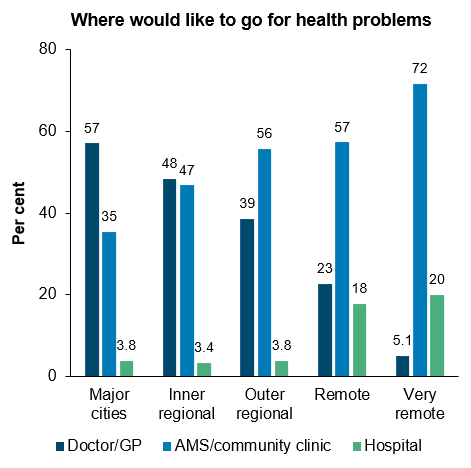
In 2018-19 in Very remote areas, 3 in 4 (75%) First Nations people usually went to an Aboriginal Medical Service (AMS) or community clinic (which may have been the only primary health care option available in many cases) (Figure 6.2).
In contrast, in Major cities, while more than 1 in 3 (35%) First Nations people would like to go to an AMS or community clinic for health problems, fewer than 1 in 6 (15%) usually went to these types of services.
Figure 6.2: Health service use and preferences among First Nations people, by remoteness, 2018–19
Source: Measure 3.17, Table D3.17.2 – AIHW and ABS analysis of National Aboriginal and Torres Strait Islander Health Survey 2018–19.
For further information, see:
- 3.12 Aboriginal and Torres Strait Islander people in the health workforce
- 3.14 Access to services compared with need
- 3.17 Regular general practitioner or health service
General practitioner services and health checks
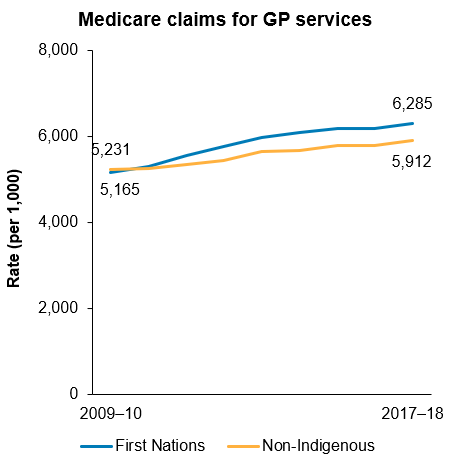
First Nations people have a slightly higher rate (ratio 1.2) of GP service use than non-Indigenous Australians, measured by the number of Medicare claims for GP services in 2017-18. This is less than the level of use required as indicated by the 2018 Australian Burden of Disease Study (ratio 2.3).
For both First Nations people and non-Indigenous Australians, the rate of GP service use rose over the decade to 2017–18 (Figure 6.3).
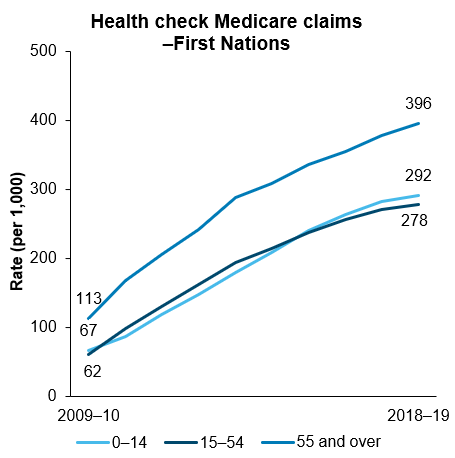
In 1999, a health check especially for First Nations people aged 55 and over was introduced, and from May 2006, First Nations-specific health checks were available for people of all ages. In May 2010, the frequency of health checks was standardised so that First Nations people of all ages were able to have a health check every year (AHMAC 2017).
Between 2009–10 and 2018–19, the number of First Nations people accessing these health checks increased by about 5-fold, from 47,283 in 2009–10 to 248,841 in 2018–19. Health check rates increased across all age groups from 68 per 1,000 to 297 per 1,000 population over this period (Figure 6.3).
Figure 6.3: GP service use by Indigenous status (2009–10 to 2017–18) and First Nations-specific health checks by age group (2009–10 to 2018–19)
Source: Measure 3.04 and 3.14, Tables D3.04.5, D3.04.6, D3.04.7, D3.14.20 – AIHW analysis of Medicare Benefits Schedule data.
For further information, see:
Child immunisation
Immunisation is highly effective in reducing illness and death caused by vaccine-preventable diseases. According to the National Immunisation Program (NIP) Schedule, Australian children are expected to have received specific immunisations by age 1, 2 and 5. First Nations people have higher rates of some vaccine preventable diseases than non-Indigenous people. For this reason, extra vaccines are available in addition to the routine vaccinations offered throughout life (pregnancy, children, adolescents, adults).
As at December 2022, based on data from the Australian Immunisation Register (AIR), the proportion of First Nations children who were fully immunised was slightly less than non-Indigenous children for those aged 1 (91% compared with 94%, respectively) and 2 (89% compared with 92%, respectively). However, for those aged 5, the proportion of First Nations children who were fully immunised was higher than that of non-Indigenous children (96% compared with 94%).
The proportion of First Nations children aged 1 and 5 who were fully immunised increased from 2013 (86% and 93%, respectively) to 2022 (91% and 96%, respectively), with no statistically significant change for First Nations children aged 2. While there was an overall improvement in immunisation coverage over the decade for First Nations children aged 1 and 5, coverage rates decreased between 2020 and 2022, coinciding with the COVID-19 pandemic. The proportion of First Nations children aged 1 who were fully immunised decreased from 94% in 2020 to 91% in 2022. For First Nations children aged 5, the proportion who were fully immunised decreased from 97% in 2020 to 96% in 2022.
Due to their still developing immune systems, annual influenza vaccination is recommended and funded under the NIP for all Australian children aged 6 months to under 5 years. In 2022, one-quarter (25%) of First Nations children in this age group received an influenza vaccination. Although this rate is slightly higher than in 2021 (23%), the immunisation rate against influenza among First Nations children remains suboptimal, with three-quarters still unvaccinated in 2022 (NCIRS 2023).
Pneumococcal is a bacterial infection that can cause pneumonia, bloodstream infection and meningitis (inflammation of the membranes around the brain) (Department of Health and Aged Care 2022). Vaccination is recommended and available for free for all Australian children at 2, 4 and 12 months of age (3 doses in total). In 2022, 96% of First Nations children aged 1 and 2 were vaccinated against the disease (Table D3.02.1).
For further information, see:
Adolescent immunisation
Human papillomavirus (HPV) is a sexually transmitted viral infection that can cause cancers and genital warts. The HPV vaccine is provided for free under the NIP for young people aged around 12 to 13, primarily through school immunisation programs. Adolescents who missed the HPV vaccination at this age can catch up for free until they turn 26 (Department of Health and Aged Care 2023).
In 2022, 83% of First Nations girls and 78% of First Nations boys had received a full dose of the HPV vaccine by age 15. These coverage rates were lower than those among all Australian girls (85%) and boys (83%) at the same age. HPV coverage was higher among First Nations adolescents living in Major cities compared to those living elsewhere. Among First Nations girls, 85% in Major cities received the HPV vaccine in 2022, followed by 83% in Inner and outer regional areas, and 78% in Remote and very remote areas. For First Nations boys, the rates were 80% in Major cities and 77% in Inner and outer regional areas as well as Remote and very remote areas (NCIRS 2023).
For further information, see:
Adult immunisation
As at 12 April 2024, 3.6% (18,100) of First Nations adults had received a COVID-19 vaccination in the previous 6 months, 82.4% (418,800) had received a COVID-19 vaccination 6 months or longer ago, and 14.1% (71,500) were unvaccinated.
The rates of recent COVID-19 vaccination were higher among older First Nations adults. Specifically, within the last 6 months, 9%, 18%, and 23% of those aged 60–69, 70–79, and 80 and over, respectively, received a COVID-19 vaccination. These rates were higher than the 1% of First Nations adults aged 18–29 and the 4% in the 50–59 age group who had received COVID-19 vaccination in the last 6 months (Department of Health and Aged Care 2024).
Since 1 March 2021, there has been mandatory reporting of influenza vaccines to the AIR. Note that these data may underestimate true coverage, due to under-reporting of adult vaccinations to the AIR, and relatively recent introduction of mandatory reporting (NCIRS 2023).
Annual influenza vaccination is recommended for all individuals aged 6 months and older, and it is provided free of charge under the NIP for First Nations people in the same age group. Rates of influenza vaccination coverage among First Nations people generally increased with age in 2022. Among older First Nations adults, 51% of those aged 50–64, 70% of those aged 65–74, and 72% of those aged 75 and over had an influenza vaccination (NCIRS 2023).
Vaccination coverage rates for First Nations adults aged 65 and over were similar to the national coverage rate (68% for all Australians aged 65–74, and 73% for all Australians aged 75 and over) (NCIRS 2023).
Pneumococcal vaccination is recommended for vulnerable populations susceptible to the disease and is provided free under the NIP for First Nations people aged 50 years and over (3 doses in total). Among First Nations people turning 71 years of age in 2022, 38% had been vaccinated against pneumococcal disease – an increase from 25% in 2021 (NCIRS 2023). The coverage rate was higher than for all Australians (38% compared with 34%).
Shingles, also known as varicella-zoster, typically affects older adults and can cause severe pain by affecting the sensory nerves (Healthdirect 2024). Among First Nations people turning 71 years of age in 2022, 37% were vaccinated for shingles, compared with 41% of all Australians (NCIRS 2023).
For further information, see:
Chronic disease management
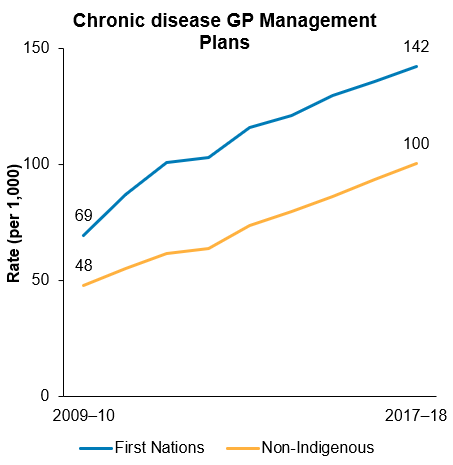
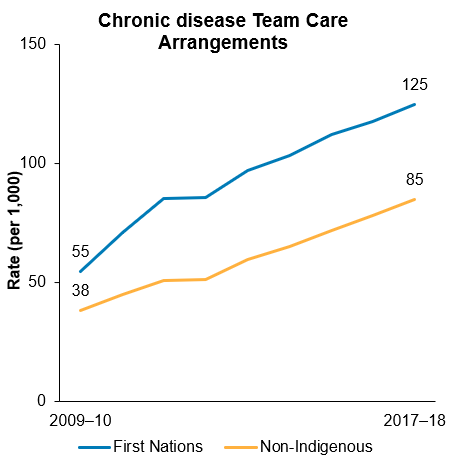
Good quality health care for people with chronic disease often involves multiple providers across multiple settings. The Chronic Disease Management GP services on the Medicare Benefits Schedule enable GPs to coordinate the health care of patients with chronic or terminal medical conditions, including patients who require multidisciplinary, team-based care from multiple providers. The Chronic Disease Management services include general practitioner management plans (GPMPs) and team care arrangements (TCAs).
In general, First Nations people have higher rates of chronic disease than non-Indigenous Australians, and hence, have a higher need for Chronic Disease Management services. Rates of Medicare claims for GPMPs and TCAs increased steadily from 2009–10 to 2017–2018 (Figure 6.4). The rate of increase has been higher among First Nations people than among non-Indigenous Australians (annual increase in the age-standardised rate of GPMPs and TCAs were 8.5 and 8.2 per 1,000 for First Nations people, compared with 6.5 and 5.7 per 1,000 for non-Indigenous Australians, respectively).
Figure 6.4: Age-standardised rate of chronic disease GP management plans and team care arrangements, by Indigenous status, 2009–10 to 2017–18
Source: Measure 3.05, Table D3.05.1 – AIHW analysis of Department of Health Medicare claims data.
For further information, see:
Access to primary health services in different areas
Measuring access to health services is complex. ‘Access’ can include:
- physical access (whether health services with sufficient capacity are located within a certain distance or drive time from where a person lives)
- approachability (awareness of a service and how it impacts health outcomes)
- appropriateness (fit between services and client needs)
- affordability
- cultural acceptability acceptability (AIHW 2014b; Levesque et al. 2013; Melbourne Vaccine Education Centre 2022).
The AIHW has modelled how First Nations people’s physical access to primary health care services (First Nations-specific primary health care services and other GP-based primary health services) varies geographically across Australia (see also AIHW 2014a, 2015b). This modelling can be used to identify areas where access to primary health care services appears to be relatively poor.
Physical access to services was modelled with reference to:
- First Nations-specific primary health care services, based on drive time to services
- GP services in general, based on drive time to services, the capacity of GP services, the size of local populations, and their per person need for primary health care.
The need for primary health care was estimated using demographic and socioeconomic characteristics of the local population.
This work shows that, overall, Australian Government-funded First Nations-specific primary health care services appear to be well positioned relative to the geographic distribution of the First Nations population, and of other GP services. However, there are several areas where First Nations people have potentially limited access to both First Nations-specific services and GP services in general.
In total, 29 medium-sized areas were estimated to have at least 200 First Nations people with no First Nations-specific primary health care services within one hour’s drive and relatively poor access to GP services based on drive times and local population needs. Table 6.1 shows specific areas with potentially poor access to primary health care services in each state and territory and remoteness classification. The areas are Statistical Areas Level 2 (SA2s) as described in the Australian Statistical Geography Standard (ASGS) (AIHW 2016). With populations generally ranging from 3,000 to 25,000 people, SA2s are designed to reflect communities that interact socially and economically. The numbers of areas are presented in Table 6.2.
Across Australia, the number of areas with potentially poor access to primary health care services are almost same for regional (Inner regional and Outer regional areas combined) and remote (Remote and Very remote areas combined) areas (Table 6.2). Identifying areas based on the number of people in them with poor access rather than on average access for the whole area is a different approach to earlier reports (AIHW 2015b) and gives somewhat different results. This approach ensures that areas that have relatively good average access but also have substantial numbers of people with poor access are not overlooked.
Table 6.1: SA2s with potentially poor access to primary health care services, 2018
|
State/territory |
SA2 name (code) |
Estimated First Nations population with low access to GPs and no ISPHCS within 1 hour’s drive(a)(b)(c)(d) |
|---|---|---|
|
NSW |
Young (101061543) |
555 |
|
NSW |
Lithgow Region (103031071) |
285 |
|
NSW |
Narrabri (110031197) |
270 |
|
NSW |
Mudgee Region – West (103031074) |
260 |
|
NSW |
Bourke – Brewarrina (105011092) |
250 |
|
NSW |
Young Region (101061544) |
215 |
|
NSW |
Mudgee Region – East (103031073) |
210 |
|
NSW |
Scone Region (106041129) |
210 |
|
Qld |
Central Highlands – East (308011190) |
670 |
|
Qld |
Broadsound – Nebo (312011338) |
360 |
|
Qld |
Gympie Region (319031514) |
295 |
|
Qld |
Barcaldine – Blackall (315031408) |
290 |
|
Qld |
Cape York (315011396) |
275 |
|
Qld |
Cooloola (319031511) |
275 |
|
Qld |
Mount Isa Region (315021406) |
205 |
|
Qld |
Collinsville (312011340) |
205 |
|
WA |
Ashburton (510031271) |
820 |
|
WA |
Derby – West Kimberley (510011263) |
755 |
|
WA |
East Pilbara (510021267) |
560 |
|
WA |
Brookton (509031246) |
405 |
|
WA |
Cunderdin (509021237) |
325 |
|
WA |
Kununurra (510011265) |
320 |
|
WA |
Exmouth (511021277) |
250 |
|
WA |
Halls Creek (510011264) |
250 |
|
SA |
Outback (406021141) |
255 |
|
Tas |
North West (604031094) |
355 |
|
NT |
West Arnhem (702031061) |
670 |
|
NT |
Sandover – Plenty (702011052) |
410 |
|
NT |
Thamarrurr (702031059) |
225 |
(a) With regards to this analysis, low access to GPs was defined by an AIHW Access score of less than 7 (for comparison, the average Access score measured for Sydney’s residents was ~10.5). This analysis is part of a forthcoming AIHW publication. Previous analysis related to this can be found in the ‘Access to primary health care relative to need for Indigenous Australians’ report (AIHW 2014a).
(b) Indigenous-specific primary health care services (ISPHCSs) included in this analysis correspond to clinical services funded by the Department of Health’s Indigenous Australians’ Health Programme that reported a GP workforce in the 2017–18 Online Services Report.
(c) First Nations populations were estimated for small geographic areas (SA1) by the AIHW for years 2016 to 2018 using Iterative Proportional Fitting with available ABS data. The analysis in this table refers to 2018 population estimates (rounded to the nearest 5 persons).
(d) The results shown include only SA2s where a sum of at least 200 First Nations people live in SA1s with access scores below 7 and who seem to live further than 1 hour’s drive from an ISPHCS clinic, based on simplified representation of peoples’ usual addresses, and drive-times calculated with Pitney Bowes’ MapInfo RouteFinder software.
Notes
1. These areas have been identified based on supporting analysis, which may be subject to small changes.
2. Areas are identified by 2 mechanisms. 1. The AIHW’s access scores, which are derived from several estimated data inputs, including GP capacities, population sizes, population distribution, per capita need, drive-times, as well as modelling parameters. Uncertainties in all of these inputs affect the quality of the results. 2. The location of ISPHCSs. Due to data gaps, some relevant service locations may not have been included and other service locations may have been included that do not offer clinical services.
3. A small number of areas were removed from the list due to known data issues or the opening of new ISPHCS clinics.
4. NSW: New South Wales, Qld: Queensland, WA: Western Australia, SA: South Australia, Tas: Tasmania, NT: Northern Territory.
Source: AIHW analyses; Online Services Report (2017–18).
Table 6.2: Number of areas with potentially poor access to primary health care services, by state and territory and predominant remoteness classification, 2018
|
State and territory |
Inner and outer regional |
Remote and very remote |
Total |
|---|---|---|---|
|
New South Wales |
7 |
1 |
8 |
|
Queensland |
4 |
4 |
8 |
|
Western Australia |
2 |
6 |
8 |
|
South Australia |
— |
1 |
1 |
|
Tasmania |
1 |
— |
1 |
|
Northern Territory |
— |
3 |
3 |
|
Australia |
14 |
15 |
29 |
1. Areas correspond to the Australian Bureau of Statistics’ SA2 boundaries (see Table 6.1 for detailed list).
2. Predominant remoteness classification based on the distribution of the First Nations populations identified as having potentially poor access.
3. None of the identified areas were part of Victoria or the Australian Capital Territory, nor were any of the areas predominantly classified as Major cities in terms of Remoteness.
Source: AIHW analyses; Online Services Report (2017–18).
For further information, see: